Marginal log likelihood comparison of expression models
Table of Contents
Introduction
We previously used a goodness of fit test and out-of-sample (marginal) log likelihood to assess whether the data were adequately described by a given expression model. Here, we compute the in-sample marginal log likelihood, in order to make direct comparisons between expression models.
Setup
import anndata
import numpy as np
import os
import pandas as pd
import scanpy as sc
import scipy.optimize as so
import scipy.special as sp
import scipy.stats as st
import scmodes
import rpy2.robjects.packages
import rpy2.robjects.pandas2ri
rpy2.robjects.pandas2ri.activate()
ashr = rpy2.robjects.packages.importr('ashr')
%matplotlib inline
%config InlineBackend.figure_formats = set(['retina'])
import matplotlib.pyplot as plt
plt.rcParams['figure.facecolor'] = 'w'
plt.rcParams['font.family'] = 'Nimbus Sans'
Results
Data
Prepare the data in h5ad.
import functools as ft

def read_chromium(sample):
  x = sc.read('/project2/mstephens/aksarkar/projects/singlecell-modes/data/negative-controls/svensson_chromium_control.h5ad')
  x = x[x.obs['sample'] == sample,x.var.filter(like='ERCC', axis='index').index]
  sc.pp.filter_genes(x, min_cells=1)
  x.var = x.var.reset_index()
  return x

def read_dropseq():
  x = sc.read('/project2/mstephens/aksarkar/projects/singlecell-modes/data/negative-controls/macosko_dropseq_control.h5ad')
  x = x[:,x.var.filter(like='ERCC', axis='index').index]
  sc.pp.filter_genes(x, min_cells=1)
  x.var = x.var.reset_index()
  return x

def read_indrops():
  x = sc.read('/project2/mstephens/aksarkar/projects/singlecell-modes/data/negative-controls/klein_indrops_control.h5ad')
  x = x[:,x.var.filter(like='ERCC', axis='index').index]
  sc.pp.filter_genes(x, min_cells=1)
  x.var = x.var.reset_index()
  return x

def read_gemcode():
  x = sc.read('/project2/mstephens/aksarkar/projects/singlecell-modes/data/negative-controls/zheng_gemcode_control.h5ad')
  x = x[:,x.var.filter(like='ERCC', axis='index').index]
  sc.pp.filter_genes(x, min_cells=1)
  x.var = x.var.reset_index()
  return x

def _read_10x(k, return_df=False, min_detect=0.01, chunk=None, chunksize=500):
  x = scmodes.dataset.read_10x(f'/project2/mstephens/aksarkar/projects/singlecell-ideas/data/10xgenomics/{k}/filtered_matrices_mex/hg19/',
                                  return_adata=not return_df, return_df=return_df, min_detect=min_detect)
  x.var.columns = ['gene', 'name']
  x.obs['size'] = x.X.sum(axis=1).A.ravel()
  if chunk is None:
    return x
  else:
    return x[:,chunk * chunksize:(chunk + 1) * chunksize]

def _mix_10x(k1, k2, min_detect=0.01, return_y=False, chunk=None, chunksize=500):
  x1 = _read_10x(k1, min_detect=0)
  x2 = _read_10x(k2, min_detect=0)
  x = x1.concatenate(x2)
  sc.pp.filter_genes(x, min_cells=min_detect * x.shape[0])
  x.obs['size'] = x.X.sum(axis=1).A.ravel()
  if chunk is None:
    return x
  else:
    return x[:,chunk * chunksize:(chunk + 1) * chunksize]

def _cd8_cd19_mix(*args, **kwargs):
  return _mix_10x('cytotoxic_t', 'b_cells', *args, **kwargs)

def _cyto_naive_mix(*args, **kwargs):
  return _mix_10x('cytotoxic_t', 'naive_t', *args, **kwargs)

def read_ipsc(chunk=None, chunksize=500):
  x = anndata.read_h5ad('/project2/mstephens/aksarkar/projects/singlecell-ideas/data/ipsc/ipsc.h5ad')
  x.obs['size'] = x.X.sum(axis=1).A.ravel()
  if chunk is None:
    return x
  else:
    return x[:,chunk * chunksize:(chunk + 1) * chunksize]

def read_liver(chunk=None, chunksize=500):
  x = anndata.read_h5ad('/project2/mstephens/aksarkar/projects/singlecell-ideas/data/human-cell-atlas/liver-caudate-lobe/liver-caudate-lobe.h5ad')
  x.obs['size'] = x.X.sum(axis=1).A.ravel()
  if chunk is None:
    return x
  else:
    return x[:,chunk * chunksize:(chunk + 1) * chunksize]

def read_kidney(chunk=None, chunksize=500):
  x = anndata.read_h5ad('/project2/mstephens/aksarkar/projects/singlecell-ideas/data/human-cell-atlas/kidney/kidney.h5ad')
  x.obs['size'] = x.X.sum(axis=1).A.ravel()
  if chunk is None:
    return x
  else:
    return x[:,chunk * chunksize:(chunk + 1) * chunksize]

def read_brain(chunk=None, chunksize=500):
  x = anndata.read_h5ad('/project2/mstephens/aksarkar/projects/singlecell-ideas/data/gtex-droncseq/gtex-droncseq.h5ad')
  sc.pp.filter_genes(x, min_counts=.01 * x.shape[0])
  x.obs['size'] = x.X.sum(axis=1).A.ravel()
  if chunk is None:
    return x
  else:
    return x[:,chunk * chunksize:(chunk + 1) * chunksize]

def read_retina(chunk=None, chunksize=500):
  x = anndata.read_h5ad('/project2/mstephens/aksarkar/projects/singlecell-ideas/data/human-cell-atlas/adult-retina/adult-retina.h5ad')
  query = x.obs['donor_organism.provenance.document_id'] == '427c0a62-9baf-42ab-a3a3-f48d10544280'
  y = x[query]
  sc.pp.filter_genes(y, min_cells=.01 * y.shape[0])
  y.obs['size'] = y.X.sum(axis=1).A.ravel()
  if chunk is None:
    return y
  else:
    return y[:,chunk * chunksize:(chunk + 1) * chunksize]

def read_pbmc_10k_v3(chunk=None, chunksize=500):
  x = anndata.read_h5ad('/scratch/midway2/aksarkar/modes/10k_pbmc_v3.h5ad')
  sc.pp.filter_genes(x, min_cells=0.01 * x.shape[0])
  x.obs['size'] = x.X.sum(axis=1).A.ravel()
  if chunk is None:
    return x
  else:
    return x[:,chunk * chunksize:(chunk + 1) * chunksize]

data = {
  'dropseq': read_dropseq,
  'indrops': read_indrops,
  'chromium1': lambda: read_chromium('20311'),
  'chromium2': lambda: read_chromium('20312'),
  'gemcode': read_gemcode,
  'cytotoxic_t': ft.partial(_read_10x, k='cytotoxic_t'),
  'b_cells': ft.partial(_read_10x, k='b_cells'),
  'ipsc': read_ipsc,
  'cytotoxic_t-b_cells': _cd8_cd19_mix,
  'cytotoxic_t-naive_t': _cyto_naive_mix,
  'pbmc_10k_v3': read_pbmc_10k_v3,
  'liver-caudate-lobe': read_liver,
  'kidney': read_kidney,
  'brain': read_brain,
  'retina': read_retina,
}

chunksize = 500
chunks = {
  'b_cells': 6417 // chunksize,
  'brain': 11744 // chunksize,
  'cytotoxic_t': 6530 // chunksize,
  'cytotoxic_t-b_cells': 6647 // chunksize,
  'cytotoxic_t-naive_t': 6246 // chunksize,
  'ipsc': 9957 // chunksize,
  'kidney': 15496 // chunksize,
  'liver-caudate-lobe': 3181 // chunksize,
  'pbmc_10k_v3': 12144 // chunksize,
  'retina': 10047 // chunksize,
}

control = list(data.keys())[:5]
non_control = list(data.keys())[5:]
Report the dimensions of each data set.
pd.DataFrame([data[k]().shape for k in data],
             columns=['num_samples', 'num_genes'],
             index=data.keys())
num_samples  num_genes
dropseq                       84         81
indrops                      953        103
chromium1                   2000         88
chromium2                   2000         88
gemcode                     1015         91
cytotoxic_t                10209       6530
b_cells                    10085       6417
ipsc                        5597       9957
cytotoxic_t-b_cells        20294       6647
cytotoxic_t-naive_t        20688       6246
pbmc_10k_v3                11769      12144
liver-caudate-lobe          8856      16200
kidney                     11233      15496
brain                      14963      11744
retina                     21285      10047
Estimate marginal log likelihood
Estimate the marginal likelihood for each data set, for each gene, for each family of expression models.
sbatch --partition=broadwl -n1 -c28 --exclusive --job-name=llik --time=30:00 -a 11-12
#!/bin/bash
source activate scmodes
python <<EOF
<<imports>>
import anndata
import multiprocessing as mp
import os
<<data>>
tasks = [(m, d) for m in ('point', 'gamma', 'point_gamma', 'unimodal', 'npmle')
         for d in data
         if not (m in ('unimodal', 'npmle') and d in chunks) and not (m == 'npmle' and d in control)]
m, d = tasks[int(os.environ['SLURM_ARRAY_TASK_ID'])]
with mp.Pool() as pool:
  x = data[d]()
  res = scmodes.benchmark.evaluate_llik(x, pool=pool, methods=[m])
  res.to_csv(f'/scratch/midway2/aksarkar/modes/llik/{d}-{m}.txt.gz', compression='gzip', sep='\t')
EOF
Fit non-parametric expression models serially for control data, to avoid memory issues.
for d in control:
  (scmodes.benchmark.evaluate_llik(data[d](), methods=['npmle'], max_grid_updates=20, tol=1e-5)
   .to_csv(f'/scratch/midway2/aksarkar/modes/llik/{d}-npmle.txt.gz', compression='gzip', sep='\t'))
Shard data sets to fit unimodal/non-parametric expression models within the
midway2 time/memory limits.
sbatch --partition=broadwl -n1 -c28 --exclusive --job-name=llik --time=4:00:00 -a 324-343
#!/bin/bash
source activate scmodes
python <<EOF
<<imports>>
import multiprocessing as mp
import os
<<data>>
tasks = [(m, d, c)
         for m in ('unimodal', 'npmle')
         for d in chunks
         for c in range(chunks[d])]
m, d, c = tasks[int(os.environ['SLURM_ARRAY_TASK_ID'])]
kwargs = dict()
if m == 'npmle':
  kwargs = {'max_grid_updates': 20, 'tol': 1e-4}
with mp.Pool() as pool:
  x = data[d](chunk=c)
  res = scmodes.benchmark.evaluate_llik(x, s=x.obs['size'], pool=pool, methods=[m], **kwargs)
  res.to_csv(f'/scratch/midway2/aksarkar/modes/llik/{d}-{m}-{c}.txt.gz', compression='gzip', sep='\t')
EOF
Move the results to permanent storage.
rsync -au /scratch/midway2/aksarkar/modes/llik/ /project2/mstephens/aksarkar/projects/singlecell-modes/data/llik/
Combine the sharded results.
for m in ('unimodal', 'npmle'):
  for k in chunks:
    if os.path.exists(f'/project2/mstephens/aksarkar/projects/singlecell-modes/data/llik/{k}-{m}-0.txt.gz'):
      (pd.concat([pd.read_csv(f'/project2/mstephens/aksarkar/projects/singlecell-modes/data/llik/{k}-{m}-{i}.txt.gz', index_col=0, sep='\t')
                  for i in range(chunks[k])])
       .to_csv(f'/project2/mstephens/aksarkar/projects/singlecell-modes/data/llik/{k}-{m}.txt.gz', sep='\t'))
Read the results.
llik = (pd.concat(
  {
    k: pd.concat([
      pd.read_csv(f'/project2/mstephens/aksarkar/projects/singlecell-modes/data/llik/{k}-{m}.txt.gz', index_col=0, sep='\t')
      for m in ('point', 'gamma', 'point_gamma', 'unimodal', 'npmle')
      if os.path.exists(f'/project2/mstephens/aksarkar/projects/singlecell-modes/data/llik/{k}-{m}.txt.gz')])
    for k in data
  })
        .reset_index(level=0)
        .rename({'level_0': 'dataset'}, axis=1))
Report the number (fraction) of genes that have likelihood ratio greater than some threshold over some baseline. Ensure monotonicity post-hoc, to get around an issue where the unimodal model sometimes does worse than expected due to not optimizing over the granularity of the grid jointly with the mode.
def fix_llik(llik):
  llik['gamma'] = np.fmax(llik['gamma'], llik['point'])
  llik['point_gamma'] = np.fmax(llik['point_gamma'], llik['gamma'])
  llik['unimodal'] = np.fmax(llik['unimodal'], llik['gamma'])
  llik['npmle'] = np.fmax.reduce([llik['npmle'], llik['unimodal'], llik['point_gamma']])
  return llik

def compare(llik, baseline, thresh=10, agg=sum):
  labels = ['point', 'gamma', 'point_gamma', 'unimodal', 'npmle']
  assert baseline in labels
  res = dict()
  for k, g in llik.groupby('dataset'):
    query = g.pivot_table(index='gene', columns='method', values='llik')
    query = fix_llik(query)
    res[k] = (query.sub(query[baseline], axis=0) > np.log(thresh)).agg(agg, axis=0)
  res = (pd.concat(res)
         .reset_index()
         .rename({'level_0': 'dataset'}, axis=1)
         .pivot_table(index='dataset', columns='method')
         [0])
  del res[baseline]
  return res[[x for x in labels if x != baseline]]
Application to control data sets
For each control data set, for each expression model, report the fraction of genes better fit by a Gamma expression model than a point mass expression model.
compare(llik[llik['dataset'].isin(control)], baseline='point', thresh=10, agg=np.mean)
method        gamma  point_gamma  unimodal     npmle
dataset
chromium1  0.261364     0.295455  0.340909  0.352273
chromium2  0.704545     0.772727  0.738636  0.772727
dropseq    0.975309     0.975309  0.987654  0.987654
gemcode    0.615385     0.615385  0.659341  0.659341
indrops    0.087379     0.106796  0.155340  0.155340
For each control data set, for each expression model, report the number of genes which have improvement in marginal log likelihood above some threshold over the Gamma expression model.
compare(llik[llik['dataset'].isin(control)], baseline='gamma', thresh=10, agg=np.mean)
method     point  point_gamma  unimodal     npmle
dataset
chromium1    0.0     0.045455  0.215909  0.215909
chromium2    0.0     0.090909  0.193182  0.261364
dropseq      0.0     0.271605  0.691358  0.790123
gemcode      0.0     0.000000  0.637363  0.637363
indrops      0.0     0.000000  0.067961  0.067961
Find the genes where a point-Gamma model improved over a Gamma model.
temp = dict()
for k, g in llik[llik['dataset'].isin(control)].groupby('dataset'):
  query = g.pivot_table(index='gene', columns='method', values='llik')
  query = fix_llik(query)
  temp[k] = query.loc[query['point_gamma'] > query['gamma'] + np.log(10)]
query = (pd.concat(temp)
         .reset_index()
         .rename({'level_0': 'dataset'}, axis=1)
         [['dataset', 'gene', 'point', 'gamma', 'point_gamma', 'unimodal', 'npmle']])
Plot the distribution of likelihood ratios for unimodal vs. point-Gamma for those genes.
plt.clf()
plt.gcf().set_size_inches(2.5, 2.5)
plt.hist((query['unimodal'] - query['point_gamma']) / np.log(10), np.linspace(-5, 105, 23), color='0.7', density=False)
plt.xlabel('log$_{10}$ likelihood ratio')
plt.ylabel('Number of genes')
plt.tight_layout()
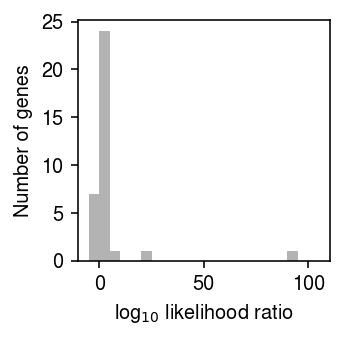
Of those genes, report the number of genes for which the likelihood ratio in favor of the unimodal model is not greater than one.
query[query['unimodal'] <= query['point_gamma']][['dataset', 'gene', 'point_gamma', 'unimodal', 'npmle']]
method    dataset        gene  point_gamma     unimodal        npmle
7       chromium2  ERCC-00071 -2426.563183 -2426.598262 -2425.085059
8       chromium2  ERCC-00081   -17.679464   -21.457014   -17.679464
10      chromium2  ERCC-00116  -174.857339  -177.229879  -174.791905
11      chromium2  ERCC-00164   -48.993924   -53.541417   -48.993924
16        dropseq  ERCC-00067   -60.613728   -61.697041   -59.606760
18        dropseq  ERCC-00077  -142.917529  -143.542989  -142.729349
26        dropseq  ERCC-00131  -341.742929  -347.518213  -337.359459
For each control data set, for each expression model, report the number of genes which have improvement in marginal log likelihood above some threshold over the unimodal expression model.
compare(llik[llik['dataset'].isin(control)], baseline='unimodal', thresh=10, agg=np.mean)
method     point  gamma  point_gamma     npmle
dataset
chromium1    0.0    0.0     0.000000  0.022727
chromium2    0.0    0.0     0.034091  0.034091
dropseq      0.0    0.0     0.012346  0.407407
gemcode      0.0    0.0     0.000000  0.120879
indrops      0.0    0.0     0.000000  0.000000
compare(llik[llik['dataset'].isin(control)], baseline='unimodal', thresh=50, agg=np.mean)
method     point  gamma  point_gamma     npmle
dataset
chromium1    0.0    0.0     0.000000  0.022727
chromium2    0.0    0.0     0.011364  0.011364
dropseq      0.0    0.0     0.012346  0.197531
gemcode      0.0    0.0     0.000000  0.010989
indrops      0.0    0.0     0.000000  0.000000
Look at the cases where NPMLE did better than unimodal.
temp = dict()
for k, g in llik[llik['dataset'].isin(control)].groupby('dataset'):
  query = g.pivot_table(index='gene', columns='method', values='llik')
  query = fix_llik(query)
  temp[k] = query.loc[query['npmle'] > query['unimodal'] + np.log(10)]
query = (pd.concat(temp)
         .reset_index()
         .rename({'level_0': 'dataset'}, axis=1)
         [['dataset', 'gene', 'point', 'gamma', 'point_gamma', 'unimodal', 'npmle']])
query
method    dataset        gene         point         gamma   point_gamma  \
0       chromium1  ERCC-00074 -10994.555832 -10026.776094 -10026.776094
1       chromium1  ERCC-00130 -10649.942268  -9570.443230  -9565.932365
2       chromium2  ERCC-00081    -22.939272    -21.457014    -17.679464
3       chromium2  ERCC-00116   -179.364459   -177.229879   -174.857339
4       chromium2  ERCC-00164    -55.455464    -53.541417    -48.993924
5         dropseq  ERCC-00002  -1266.423096   -611.402635   -611.394799
6         dropseq  ERCC-00003  -1030.362549   -500.306576   -500.306517
7         dropseq  ERCC-00004   -974.663055   -545.042159   -545.042159
8         dropseq  ERCC-00019   -503.467112   -228.309470   -224.000070
9         dropseq  ERCC-00025   -556.002790   -277.973395   -276.683859
10        dropseq  ERCC-00034   -697.362242   -193.063000   -186.044807
11        dropseq  ERCC-00039   -274.668122    -99.735102    -99.734779
12        dropseq  ERCC-00042  -1153.137413   -483.932271   -483.732803
13        dropseq  ERCC-00043  -1102.442375   -501.721756   -501.721753
14        dropseq  ERCC-00044   -828.876427   -376.808649   -375.842974
15        dropseq  ERCC-00053   -918.332827   -354.327829   -350.009082
16        dropseq  ERCC-00060   -799.485748   -456.121055   -456.110088
17        dropseq  ERCC-00062  -1155.604274   -370.017177   -369.687577
18        dropseq  ERCC-00071   -856.315238   -360.975674   -357.071140
19        dropseq  ERCC-00074  -1511.162109   -642.333522   -642.333522
20        dropseq  ERCC-00076   -767.107849   -406.689904   -406.689904
21        dropseq  ERCC-00079   -577.893220   -321.847139   -317.379547
22        dropseq  ERCC-00084   -609.794518   -253.338088   -244.021041
23        dropseq  ERCC-00085   -412.040273    -96.799237    -92.931414
24        dropseq  ERCC-00092  -1082.852468   -421.866830   -420.327480
25        dropseq  ERCC-00095   -683.153752   -381.605546   -381.578051
26        dropseq  ERCC-00096  -1237.653809   -617.412762   -617.412762
27        dropseq  ERCC-00108   -907.245140   -475.172703   -475.172647
28        dropseq  ERCC-00112   -761.993153   -382.114154   -381.777423
29        dropseq  ERCC-00113  -1074.117126   -538.694413   -538.694413
30        dropseq  ERCC-00116   -694.544499   -367.351234   -364.166669
31        dropseq  ERCC-00130  -1253.007568   -610.624357   -610.617778
32        dropseq  ERCC-00131   -723.520929   -356.755781   -341.742929
33        dropseq  ERCC-00144   -544.076984   -209.953994   -200.138600
34        dropseq  ERCC-00145   -878.956902   -454.270630   -454.176155
35        dropseq  ERCC-00160   -666.668557   -250.674782   -245.116842
36        dropseq  ERCC-00165   -988.263237   -338.511813   -333.741251
37        dropseq  ERCC-00168   -206.899650    -63.417678    -63.417678
38        gemcode  ERCC-00009  -4510.433970  -4118.285506  -4118.285506
39        gemcode  ERCC-00034  -1918.709922  -1755.789605  -1755.789560
40        gemcode  ERCC-00035  -2716.800175  -2629.744168  -2629.744168
41        gemcode  ERCC-00053  -2442.401288  -2282.002956  -2282.002774
42        gemcode  ERCC-00060  -3244.700606  -3121.574336  -3121.571758
43        gemcode  ERCC-00071  -3397.714914  -3153.035031  -3153.032709
44        gemcode  ERCC-00078  -3001.456071  -2780.138679  -2780.138464
45        gemcode  ERCC-00079  -3482.725608  -3123.857966  -3123.857966
46        gemcode  ERCC-00085  -1168.949499  -1017.629741  -1017.629741
47        gemcode  ERCC-00131  -2322.557758  -2232.505889  -2232.505889
48        gemcode  ERCC-00160  -2675.612720  -2483.744290  -2483.744290

method     unimodal        npmle
0      -9842.350977 -9836.615070
1      -9517.260498 -9512.740669
2        -21.457014   -17.679464
3       -177.229879  -174.791905
4        -53.541417   -48.993924
5       -607.044232  -602.568171
6       -495.700019  -493.064685
7       -541.536046  -535.953133
8       -218.292515  -211.697691
9       -269.145382  -265.821108
10      -182.540192  -177.232823
11       -96.597446   -94.267453
12      -474.604140  -465.783799
13      -495.445359  -492.072696
14      -367.108223  -362.801161
15      -349.729527  -343.411482
16      -451.908588  -448.326980
17      -366.244318  -361.491025
18      -352.703587  -347.498260
19      -633.682726  -628.504607
20      -401.599442  -397.902139
21      -316.955326  -312.049294
22      -239.707689  -235.064641
23       -90.357506   -86.213971
24      -416.618139  -411.577139
25      -377.882827  -374.758270
26      -610.680517  -607.089068
27      -468.358776  -465.369989
28      -375.017848  -371.379920
29      -530.850285  -526.408639
30      -361.972045  -359.002267
31      -607.453443  -603.784909
32      -347.518213  -337.359459
33      -199.219463  -196.410539
34      -450.391125  -447.074294
35      -239.914256  -236.303790
36      -329.815130  -326.313666
37       -58.337531   -55.154366
38     -4077.611595 -4074.608323
39     -1642.184750 -1639.243826
40     -2524.676224 -2522.096733
41     -2144.102157 -2140.568698
42     -3029.049844 -3026.387906
43     -2987.354978 -2984.847676
44     -2637.040425 -2631.940091
45     -2924.518623 -2922.167038
46      -943.334301  -940.957160
47     -2141.876978 -2138.628185
48     -2348.491637 -2344.786146
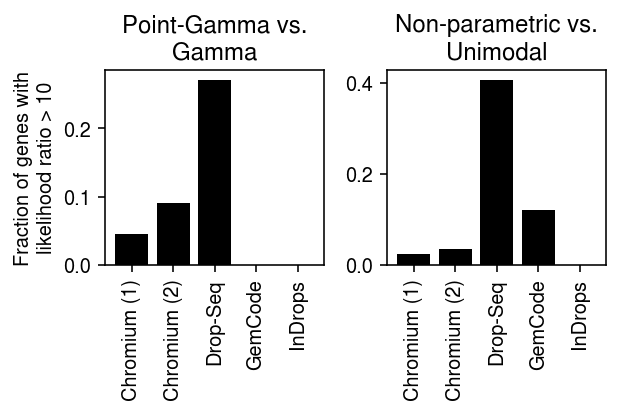
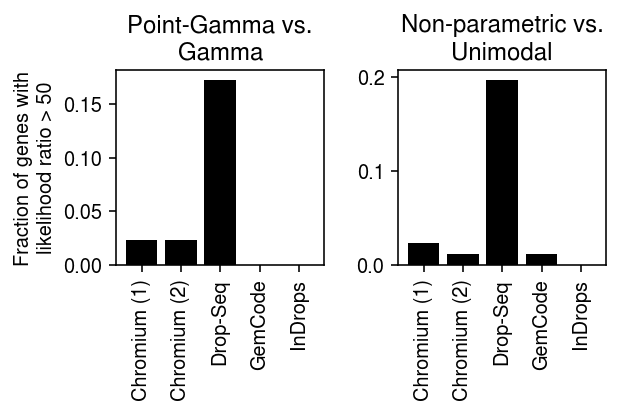
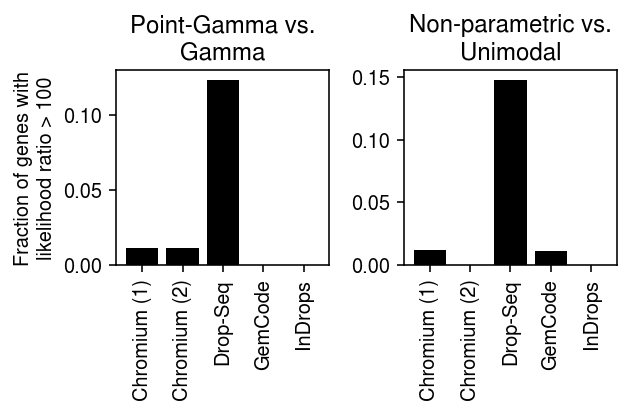
Plot the results.
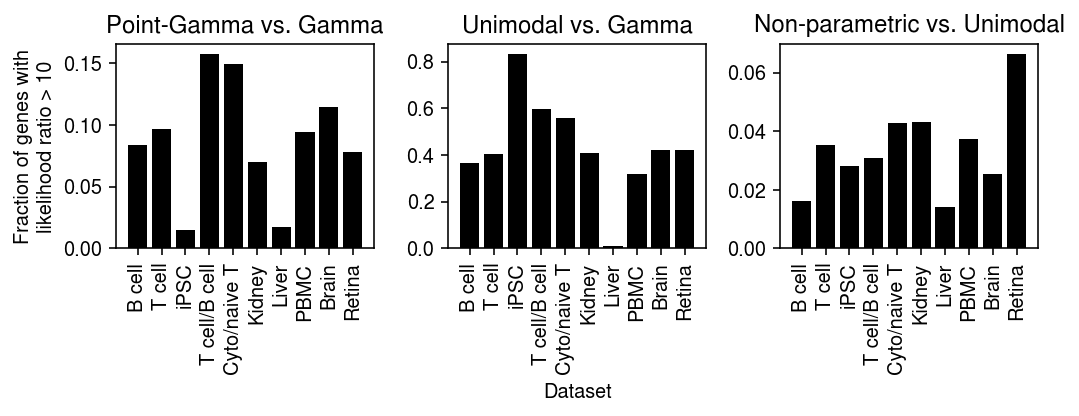
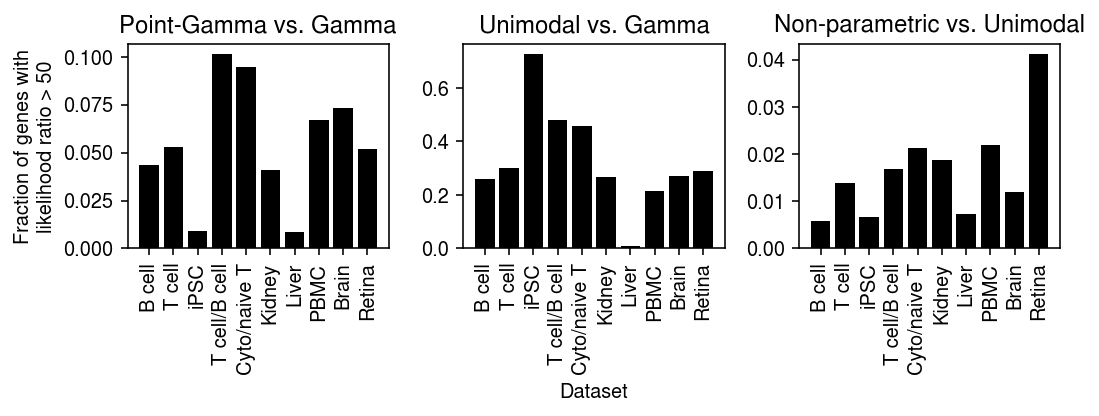
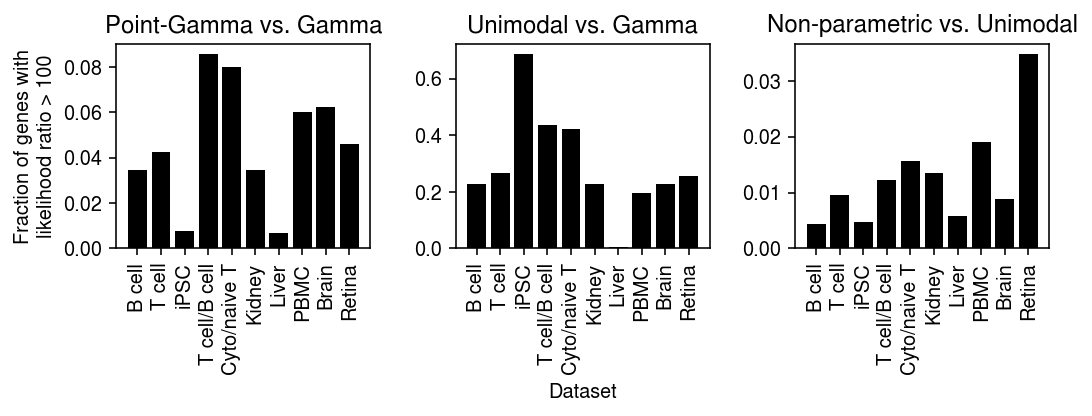
def _plot(llik, keys, labels, thresh=10):
  query1 = compare(llik, baseline='gamma', thresh=thresh, agg='mean')
  query2 = compare(llik, baseline='unimodal', thresh=thresh, agg='mean')

  plt.clf()
  fig, ax = plt.subplots(1, 2)
  fig.set_size_inches(5, 3)
  ax[0].bar(range(query1.shape[0]), query1.loc[keys, 'point_gamma'], color='k')
  ax[0].set_xticks(range(query1.shape[0]))
  ax[0].set_xticklabels(labels, rotation=90)
  ax[0].set_title('Point-Gamma vs.\nGamma')
  ax[0].set_ylabel(f'Fraction of genes with\nlikelihood ratio > {thresh}')

  ax[1].bar(range(query2.shape[0]), query2.loc[keys, 'npmle'], color='k')
  ax[1].set_xticks(range(query2.shape[0]))
  ax[1].set_xticklabels(labels, rotation=90)
  ax[1].set_title('Non-parametric vs.\nUnimodal')

  fig.tight_layout()
keys = ['chromium1', 'chromium2', 'dropseq', 'gemcode', 'indrops']
labels = ['Chromium (1)', 'Chromium (2)', 'Drop-Seq', 'GemCode', 'InDrops']
_plot_control(llik, thresh=10)
_plot_control(llik, thresh=50)
_plot_control(llik, thresh=100)
Application to biological data sets
Report the fraction of genes with strong evidence over a point mass expression model.
compare(llik[llik['dataset'].isin(non_control)], baseline='point', thresh=100, agg='mean')
method                  gamma  point_gamma  unimodal     npmle
dataset
b_cells              0.637993     0.676017  0.707652  0.727131
brain                0.916042     0.942098  0.946185  0.954785
cytotoxic_t          0.635988     0.680092  0.709342  0.737519
cytotoxic_t-b_cells  0.848804     0.893937  0.901309  0.916052
cytotoxic_t-naive_t  0.761447     0.818764  0.835895  0.859110
ipsc                 0.996284     0.997489  0.998895  0.998996
kidney               0.591443     0.605318  0.645199  0.654491
liver-caudate-lobe   0.120432     0.133642  0.127716  0.139136
pbmc_10k_v3          0.722744     0.737895  0.763093  0.771821
retina               0.488404     0.508112  0.569822  0.578282
The liver data shows little expression variation because the relative gene expression is low for almost all genes.
dat = data['liver-caudate-lobe']()
fits = np.array([scmodes.ebpm.ebpm_point(dat.X[:,j].A.ravel(), dat.X.sum(axis=1).A.ravel()) for j in range(dat.shape[1])]).squeeze()
np.median(dat.X.sum(axis=1).A.ravel()) * np.percentile(np.exp(fits[:,0]), 99.7)
0.8378116504024844
This could mean some gene is dominating relative gene expression.
dat.var.iloc[np.argmax(fits[:,0])]
featurekey       ENSG00000198804
featurename               MT-CO1
featuretype       protein_coding
chromosome                  chrM
featurestart                5904
featureend                  7445
isgene                      True
genus_species       Homo sapiens
n_cells                     8856
Name: 17897, dtype: object
np.exp(np.max(fits[:,0]))
0.16776194506343123
Report the fraction of genes with strong evidence over a Gamma expression model.
compare(llik[llik['dataset'].isin(non_control)], baseline='gamma', thresh=100, agg='mean')
method               point  point_gamma  unimodal     npmle
dataset
b_cells                0.0     0.034751  0.228923  0.239676
brain                  0.0     0.062415  0.227776  0.247701
cytotoxic_t            0.0     0.042726  0.265850  0.284533
cytotoxic_t-b_cells    0.0     0.085753  0.438092  0.455694
cytotoxic_t-naive_t    0.0     0.080051  0.421230  0.446846
ipsc                   0.0     0.007733  0.687657  0.711861
kidney                 0.0     0.034603  0.228800  0.252221
liver-caudate-lobe     0.0     0.006779  0.006481  0.012292
pbmc_10k_v3            0.0     0.060030  0.196146  0.207839
retina                 0.0     0.046183  0.256893  0.278591
Report the fraction of genes with suggestive evidence over a Gamma expression model.
compare(llik[llik['dataset'].isin(non_control)], baseline='gamma', thresh=10, agg='mean')
method               point  point_gamma  unimodal     npmle
dataset
b_cells                0.0     0.083840  0.364812  0.391772
brain                  0.0     0.114612  0.420044  0.459980
cytotoxic_t            0.0     0.096631  0.404747  0.449770
cytotoxic_t-b_cells    0.0     0.157665  0.597262  0.630961
cytotoxic_t-naive_t    0.0     0.149376  0.557157  0.603106
ipsc                   0.0     0.014964  0.832580  0.854575
kidney                 0.0     0.050336  0.365965  0.414107
liver-caudate-lobe     0.0     0.028395  0.019753  0.043519
pbmc_10k_v3            0.0     0.094779  0.316864  0.348403
retina                 0.0     0.078133  0.421121  0.456057
Report the fraction of genes with strong evidence over a unimodal expression model.
compare(llik[llik['dataset'].isin(non_control)], baseline='unimodal', thresh=100, agg='mean')['npmle'].sort_values()
dataset
b_cells                0.004363
ipsc                   0.004821
liver-caudate-lobe     0.005736
brain                  0.008941
cytotoxic_t            0.009648
cytotoxic_t-b_cells    0.012336
kidney                 0.013481
cytotoxic_t-naive_t    0.015690
pbmc_10k_v3            0.019104
retina                 0.034836
Name: npmle, dtype: float64
Plot the results.
keys = ['b_cells', 'cytotoxic_t', 'ipsc', 'cytotoxic_t-b_cells', 'cytotoxic_t-naive_t', 'kidney', 'liver-caudate-lobe', 'pbmc_10k_v3', 'brain', 'retina']
labels = ['B cell', 'T cell', 'iPSC', 'T cell/B cell', 'Cyto/naive T', 'Kidney', 'Liver', 'PBMC', 'Brain', 'Retina']
_plot(llik, thresh=10)
_plot(llik, thresh=50)
_plot(llik, thresh=100)
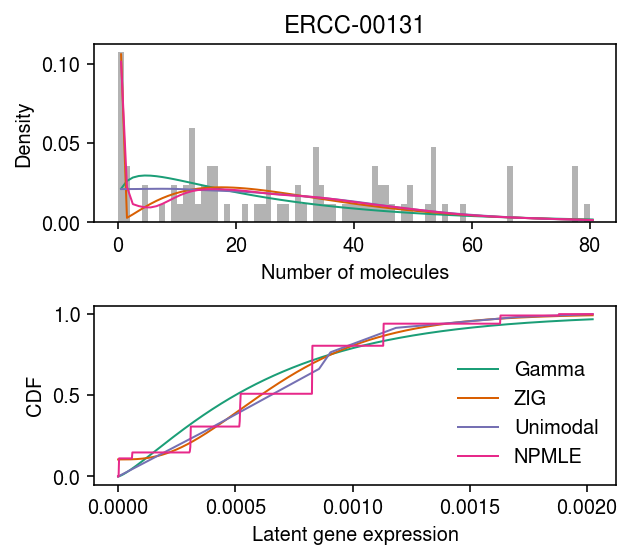
Drop-Seq spike-in gene
dat = data['dropseq']()
x = dat[:,dat.var.iloc[:,0] == 'ERCC-00131'].X.A.ravel()
s = dat.X.sum(axis=1).A.ravel()
y = np.arange(x.max() + 1)
grid = np.linspace(0, (x / s).max(), 1000)

pmf = dict()
cdf = dict()

gamma_res = scmodes.ebpm.ebpm_gamma(x, s)
pmf['Gamma'] = np.array([scmodes.benchmark.gof._zig_pmf(k, size=s, log_mu=gamma_res[0], log_phi=-gamma_res[1]).mean()
                         for k in y])
cdf['Gamma'] = st.gamma(a=np.exp(gamma_res[1]), scale=np.exp(gamma_res[0] - gamma_res[1])).cdf(grid)

point_gamma_res = scmodes.ebpm.ebpm_point_gamma(x, s)
cdf['ZIG'] = sp.expit(point_gamma_res[2]) + sp.expit(-point_gamma_res[2]) * st.gamma(a=np.exp(point_gamma_res[1]), scale=np.exp(point_gamma_res[0] - point_gamma_res[1])).cdf(grid)
pmf['ZIG'] = np.array([scmodes.benchmark.gof._zig_pmf(k, size=s, log_mu=point_gamma_res[0], log_phi=-point_gamma_res[1], logodds=point_gamma_res[2]).mean()
                       for k in y])

# Important: tune gridmult
unimodal_res = ebpm_unimodal_tune(x, s)
g = np.array(unimodal_res.rx2('fitted_g'))
g = g[:,g[0] > 1e-8]
a = np.fmin(g[1], g[2])
b = np.fmax(g[1], g[2])
comp_dens_conv = np.array([((st.gamma(a=k + 1, scale=1 / s.reshape(-1, 1)).cdf(b.reshape(1, -1)) - st.gamma(a=k + 1, scale=1 / s.reshape(-1, 1)).cdf(a.reshape(1, -1))) / np.outer(s, b - a)).mean(axis=0) for k in y])
comp_dens_conv[:,0] = st.poisson(mu=s.reshape(-1, 1) * b[0]).pmf(y).mean(axis=0)
pmf['Unimodal'] = comp_dens_conv @ g[0]
cdf['Unimodal'] = ashr.cdf_ash(unimodal_res, grid).rx2('y').ravel()

npmle_res = scmodes.ebpm.ebpm_npmle(x, s, max_grid_updates=5, tol=1e-5)
g = np.array(npmle_res.rx2('fitted_g'))
g = g[:,g[0] > 1e-8]
a = np.fmin(g[1], g[2])
b = np.fmax(g[1], g[2])
comp_dens_conv = np.array([((st.gamma(a=k + 1, scale=1 / s.reshape(-1, 1)).cdf(b.reshape(1, -1)) - st.gamma(a=k + 1, scale=1 / s.reshape(-1, 1)).cdf(a.reshape(1, -1))) / np.outer(s, b - a)).mean(axis=0) for k in y])
pmf['NPMLE'] = comp_dens_conv @ g[0]
cdf['NPMLE'] = ashr.cdf_ash(npmle_res, grid).rx2('y').ravel()
1 - f4fd818b-e60b-4cc1-9c8b-69cfa67ba463
cm = plt.get_cmap('Paired')
plt.clf()
fig, ax = plt.subplots(2, 1)
fig.set_size_inches(4.5, 4)

ax[0].hist(x, bins=y, color='0.7', density=True)
for i, k in enumerate(pmf):
  ax[0].plot(y + .5, pmf[k], lw=1, c=cm(i))
ax[0].set_xlabel('Number of molecules')
ax[0].set_ylabel('Density')
ax[0].set_title('ERCC-00131')

for i, k in enumerate(pmf):
  ax[1].plot(grid, cdf[k], lw=1, c=cm(i), label=k)
ax[1].legend(frameon=False)
ax[1].set_xlabel('Latent gene expression')
ax[1].set_ylabel('CDF')

fig.tight_layout()
Issue in ash
Find all genes where a simpler expression model (point, Gamma, point-Gamma) did better than a unimodal expression model.
temp = dict()
for k, g in llik[llik['dataset'].isin(non_control)].groupby('dataset'):
  query = g.pivot_table(index='gene', columns='method', values='llik')
  temp[k] = query.loc[(query.sub(query['unimodal'], axis=0)[['point', 'gamma', 'point_gamma']] > thresh).apply(any, axis=1)]
query = (pd.concat(temp)
         .reset_index()
         .rename({'level_0': 'dataset'}, axis=1)
         [['dataset', 'gene', 'point', 'gamma', 'point_gamma', 'unimodal', 'npmle']])
query.shape
(3253, 7)
def ebpm_unimodal_tune(x, s):
  x = pd.Series(x)
  s = pd.Series(s)

  def _loss_gridmult(gridmult, mode, x, s):
    llik = ashr.ash_pois(x, s, mixcompdist='halfuniform', mode=mode,
                         gridmult=gridmult, outputlevel='loglik',
                         control=rpy2.robjects.ListVector({'tol.svd': 0})).rx2('loglik')[0]
    print(f'{mode:>9.6g} {gridmult:>9.6g} {llik:>9.6g}')
    return -llik

  def _loss_mode(mode, x, s):
    print(f'{"mode":>9s} {"gridmult":>9s} {"llik":>9s}')
    opt = so.minimize_scalar(_loss_gridmult, bracket=[1.1, 2], bounds=[1, 2],
                             method='bounded', args=(mode, x, s), tol=1e-2)
    assert opt.success
    return opt.fun

  opt = so.minimize_scalar(_loss_mode, bracket=[0, (x / s).max()],
                           bounds=[0, (x / s).max()], method='bounded', args=(x, s),
                           tol=1e-5)
  mode = opt.x
  assert opt.success
  print(f'Converged to mode={mode:>9.6g}')

  opt = so.minimize_scalar(_loss_gridmult, bracket=[1.1, 2], bounds=[1, 2],
                           method='bounded', args=(mode, x, s), tol=1e-2)
  assert opt.success
  gridmult = opt.x
  print(f'Converged to {gridmult:>9.6g}')

  res = ashr.ash_pois(x, s, mixcompdist='halfuniform', mode=mode, gridmult=gridmult, control=rpy2.robjects.ListVector({'tol.svd': 0}))
  return res
Report the fraction of genes for which NPMLE did better than the best of point mass, Gamma, and unimodal.
thresh = 10
temp = dict()
for k, g in llik[llik['dataset'].isin(non_control)].groupby('dataset'):
  query = g.pivot_table(index='gene', columns='method', values='llik')
  baseline = query[['point', 'gamma', 'unimodal']].max(axis=1)
  temp[k] = (query['npmle'] > baseline + thresh).mean(axis=0)
res = (pd.Series(temp)
         .reset_index()
         .rename({'index': 'dataset', 0: 'npmle'}, axis=1))
res
dataset     npmle
0              b_cells  0.000156
1                brain  0.001448
2          cytotoxic_t  0.000766
3  cytotoxic_t-b_cells  0.003460
4  cytotoxic_t-naive_t  0.001441
5                 ipsc  0.001908
6               kidney  0.003293
7   liver-caudate-lobe  0.000074
8          pbmc_10k_v3  0.010293
9               retina  0.013935
For each data set, for each expression model, report the number of genes which have improvement in marginal log likelihood above some threshold over the non-parametric expression model.
compare(llik[llik['dataset'].isin(non_control)], baseline='npmle', agg='mean')
method                  point     gamma  point_gamma  unimodal
dataset
b_cells              0.106436  0.116254     0.116098  0.093657
brain                0.067439  0.103713     0.108396  0.112568
cytotoxic_t          0.096325  0.101378     0.101378  0.058499
cytotoxic_t-b_cells  0.113886  0.129081     0.130886  0.115390
cytotoxic_t-naive_t  0.124560  0.133045     0.134806  0.100865
ipsc                 0.000000  0.000000     0.000000  0.000000
kidney               0.000000  0.017705     0.018140  0.018761
liver-caudate-lobe   0.000000  0.021605     0.021716  0.017582
pbmc_10k_v3          0.018281  0.034091     0.036397  0.037961
retina               0.000299  0.035334     0.036031  0.033841
For each control data set, for each expression model, report the number of genes which have improvement in marginal log likelihood above some threshold over the non-parametric expression model.
compare(llik[llik['dataset'].isin(control)], baseline='npmle')
method     point  gamma  point_gamma  unimodal
dataset
chromium1      0      1            0         2
chromium2      1      1            1         0
dropseq        0      0            0         0
gemcode        0      0            0         0
indrops        0      0            0         0
thresh = 10
temp = dict()
for k, g in llik[llik['dataset'].isin(control)].groupby('dataset'):
  query = g.pivot_table(index='gene', columns='method', values='llik')
  temp[k] = query.loc[(query.sub(query['npmle'], axis=0) > thresh).apply(any, axis=1)]
query = (pd.concat(temp)
         .reset_index()
         .rename({'level_0': 'dataset'}, axis=1)
         [['dataset', 'gene', 'point', 'gamma', 'point_gamma', 'unimodal', 'npmle']])
query
method    dataset        gene       point       gamma  point_gamma  \
0       chromium1  ERCC-00054 -140.374338 -139.785657  -139.403474
1       chromium1  ERCC-00116 -110.987988 -103.145967  -108.102592
2       chromium2  ERCC-00142  -28.006585  -28.006585   -28.011618

method    unimodal       npmle
0      -139.360976 -149.364211
1      -102.207858 -115.402711
2      -148.213405  -43.356179
These cases can be explained by not starting the iterative refinement procedure with a fine enough grid.
temp = dict()
for k, g in query.groupby('dataset'):
  dat = data[k]()
  for _, row in g.iterrows():
    temp[(k, row['gene'])] = scmodes.ebpm.ebpm_npmle(
      dat[:,dat.var.iloc[:,0] == row['gene']].X.A.ravel(),
      dat.X.sum(axis=1).A.ravel(),
      K=1024,
      max_grid_updates=10,
      tol=1e-5,
      verbose=True).rx2('loglik')[0]
pd.Series(temp).reset_index().rename({'level_0': 'dataset', 'level_1': 'gene', 0: 'npmle'}, axis=1)
dataset        gene       npmle
0  chromium1  ERCC-00054 -139.356572
1  chromium1  ERCC-00116 -102.119712
2  chromium2  ERCC-00142  -28.282124
Examples
Unimodal vs. Gamma
pivot = dict()
for k, g in llik.groupby('dataset'):
  query = g.pivot_table(index='gene', columns='method', values='llik')
  query = fix_llik(query)
  pivot[k] = query
pivot = pd.concat(pivot)
query = (pivot
         .iloc[np.argsort(-pivot['unimodal'] + pivot['gamma'])]
         .reset_index()
         .rename({'level_0': 'dataset'}, axis=1))
query = query.loc[query['unimodal'] >= query['npmle'], ['dataset', 'gene', 'gamma', 'unimodal']]
query.head(n=10)
method      dataset             gene         gamma      unimodal
56           kidney  ENSG00000196565  -5298.749426  -4178.292122
147     pbmc_10k_v3  ENSG00000163736  -6048.916822  -5388.534550
170     pbmc_10k_v3  ENSG00000180573  -6213.441429  -5615.144543
174          retina  ENSG00000204091  -3643.764919  -3052.640395
188     pbmc_10k_v3  ENSG00000101856  -6772.157948  -6216.912371
202          kidney  ENSG00000206172  -2534.658089  -2005.458099
220     pbmc_10k_v3  ENSG00000257764 -16933.243032 -16435.610729
230           brain              VWF  -1724.793605  -1253.016660
338     pbmc_10k_v3  ENSG00000211898  -8754.350377  -8427.946446
370     pbmc_10k_v3  ENSG00000211677  -8541.039933  -8244.471002
cm = plt.get_cmap('Dark2')
plt.clf()
fig, ax = plt.subplots(2, 4)
fig.set_size_inches(8, 4)
for a, (_, row) in zip(ax.ravel(), query.iterrows()):
  dat = data[row['level_0']]()
  x = dat[:,dat.var.iloc[:,0] == row['gene']].X.A.ravel()
  y = np.arange(x.max() + 1)
  a.hist(x, bins=y, color='k')
  a.set_title(row['gene'])
for a in ax:
  a[0].set_ylabel('Number of cells')
for a in ax.T:
  a[-1].set_xlabel('Number of molecules')
ax[1,1].legend(frameon=False)
fig.tight_layout()
dat = data['pbmc_10k_v3']()
pmf = dict()
cdf = dict()
gene = 'ENSG00000163736'

x = dat[:,dat.var['ensg'] == gene].X.A.ravel()
s = dat.obs['size']
y = np.arange(x.max() + 2)
lam = x / s
grid = np.logspace(-11, -3, 1000)

print(f'fitting {gene} (Gamma)')
temp = scmodes.ebpm.ebpm_gamma(x, s, tol=1e-5, extrapolate=True)
cdf['Gamma'] = st.gamma(a=np.exp(temp[1]), scale=np.exp(temp[0] - temp[1])).cdf(grid)
pmf['Gamma'] = np.array([scmodes.benchmark.gof._zig_pmf(k, size=s, log_mu=temp[0], log_phi=-temp[1]).mean()
                      for k in y])

print(f'fitting {gene} (Point-Gamma)')
temp = scmodes.ebpm.ebpm_point_gamma(x, s, tol=1e-5, extrapolate=True)
cdf['Point-Gamma'] = sp.expit(temp[2]) + sp.expit(-temp[2]) * st.gamma(a=np.exp(temp[1]), scale=np.exp(temp[0] - temp[1])).cdf(grid)
pmf['Point-Gamma'] = np.array([scmodes.benchmark.gof._zig_pmf(k, size=s, log_mu=temp[0], log_phi=-temp[1], logodds=temp[2]).mean()
                      for k in y])

print(f'fitting {gene} (Unimodal)')
unimodal_res = scmodes.ebpm.ebpm_unimodal(x, s, mixcompdist='halfuniform')
g = np.array(unimodal_res.rx2('fitted_g'))
a = np.fmin(g[1], g[2])
b = np.fmax(g[1], g[2])
comp_dens_conv = np.array([((st.gamma(a=k + 1, scale=1 / s.values.reshape(-1, 1)).cdf(b.reshape(1, -1)) - st.gamma(a=k + 1, scale=1 / s.values.reshape(-1, 1)).cdf(a.reshape(1, -1))) / np.outer(s, b - a)).mean(axis=0) for k in y])
comp_dens_conv[:,0] = st.poisson(mu=s.values.reshape(-1, 1) * b[0]).pmf(y).mean(axis=0)
pmf['Unimodal'] = comp_dens_conv @ g[0]
cdf['Unimodal'] = ashr.cdf_ash(unimodal_res, grid).rx2('y').ravel()
cm = plt.get_cmap('Dark2')
plt.clf()
fig, ax = plt.subplots(2, 1)
fig.set_size_inches(4, 4)

for a, c in zip(ax, ['k', '0.7']):
  a.hist(x, bins=y, color=c)
  a.set_ylabel('Number of cells')
for i, (k, ls) in enumerate(zip(pmf, ['-', (0, (3, 3)), '-'])):
  ax[1].plot(y + 0.5, x.shape[0] * pmf[k], lw=1, ls=ls, c=cm(i), label=k)
ax[0].set_title(dat.var.loc[dat.var['ensg'] == gene, 'name'][0])
ax[1].set_xlabel('Number of molecules')
ax[1].set_ylim(0, 10)
ax[1].legend(frameon=False)
fig.tight_layout()
Examine why point-Gamma does not fit better than Gamma. First, check if the initialization is a problem.
dat = data['pbmc_10k_v3']()
gene = 'ENSG00000163736'
x = dat[:,dat.var['ensg'] == gene].X.A.ravel()
s = dat.obs['size'].values.ravel()

fit0 = pd.Series(scmodes.ebpm.ebpm_gamma(x, s, tol=1e-5, extrapolate=True),
                 index=['log_mean', 'log_inv_disp', 'llik'])
fit1 = pd.Series(scmodes.ebpm.ebpm_point_gamma(x, s, init=np.array([-sp.expit((x > 0).mean()), 1, s[x > 0].sum() / x[x > 0].sum()]), tol=1e-5, extrapolate=True),
                 index=['log_mean', 'log_inv_disp', 'logodds', 'llik'])
pd.DataFrame({'gamma': fit0, 'point_gamma': fit1}).T
llik  log_inv_disp  log_mean  logodds
gamma       -6048.895515     -4.267916 -7.292463      NaN
point_gamma -6048.897291     -4.268733 -7.292503 -9.28471
Plot the histogram restricting to entries greater than zero.
temp = scmodes.ebpm.ebpm_gamma(x[x > 0], s[x > 0], tol=1e-7, extrapolate=True)
pmf = np.array([scmodes.benchmark.gof._zig_pmf(k, size=s, log_mu=temp[0], log_phi=-temp[1]).mean() for k in y])

plt.clf()
fig, ax = plt.subplots(2, 1, sharex=True)
fig.set_size_inches(4, 4)
for a in ax:
  a.hist(x[x > 0], bins=y, color='0.7')
  a.set_ylabel('Number of cells')
name = dat.var.loc[dat.var['ensg'] == gene, 'name'][0]
ax[0].set_title(f'{name} (non-zero observations)')
ax[1].plot(y + .5, (x > 0).sum() * pmf, lw=1, c=plt.get_cmap('Dark2')(0))
ax[1].set_ylim(0, 10)
ax[1].set_yticks([0, 5, 10])
ax[1].set_xlabel('Number of molecules')
fig.tight_layout()
Non-parametric vs. Gamma
Report the likelihood ratio for RPS4Y1.
temp = (query
 .iloc[np.argsort(-query['npmle'] + query['unimodal'])]
 .merge(dat.var, left_index=True, right_on='index')
 .query('name == "RPS4Y1"')
 [['unimodal', 'npmle']])
np.exp(temp['npmle'] - temp['unimodal'])
3911    5.912158e+65
dtype: float64
We previously used GOF to test whether the fitted point-Gamma expression model at each donor was adequate. Now, compare candidate models within each donor using log likelihood.
dat = data['ipsc']()
x = dat[:,dat.var['name'] == 'RPS4Y1'].X.A.ravel()
s = dat.obs['mol_hs'].values.ravel()
fits = dict()
for donor in dat.obs['chip_id'].unique():
  idx = dat.obs['chip_id'] == donor
  for m in ('point', 'gamma', 'point_gamma'):
    print(f'fitting {donor} ({m})')
    fits[(donor, m)] = getattr(scmodes.ebpm, f'ebpm_{m}')(x[idx], s[idx])[-1]
  for m in ('unimodal', 'npmle'):
    print(f'fitting {donor} ({m})')
    fits[(donor, m)] = getattr(scmodes.ebpm, f'ebpm_{m}')(x[idx], s[idx]).rx2('loglik')[0]
rpsry1_res = (fix_llik(pd.DataFrame(fits, index=[0]).T
 .reset_index()
 .pivot_table(index='level_0', columns='level_1', values=0))
              [['gamma', 'point_gamma', 'unimodal', 'npmle']])
rpsry1_res[rpsry1_res['unimodal'] > rpsry1_res['gamma'] + np.log(100)].shape[0]
28
rpsry1_res[rpsry1_res['unimodal'] > rpsry1_res['point_gamma'] + np.log(100)].shape[0]
11
rpsry1_res[rpsry1_res['npmle'] > rpsry1_res['unimodal'] + np.log(100)]
level_1       gamma  point_gamma    unimodal       npmle
level_0
NA18499 -317.457861  -290.457109 -309.357427 -289.500129
NA18522 -358.012379  -358.012379 -347.357464 -341.198174
NA19101 -337.264503  -337.264503 -327.732194 -317.848643
NA19152 -275.581828  -262.996097 -268.110564 -259.857938
query = pivot.loc['ipsc']
temp = (query
 .iloc[np.argsort(-query['npmle'] + query['unimodal'])]
 .merge(dat.var, left_index=True, right_on='index')
 .query('name == "SKP1"')
 [['unimodal', 'npmle']])
np.exp(temp['npmle'] - temp['unimodal'])
2717    3.115929
dtype: float64
x = dat[:,dat.var['name'] == 'SKP1'].X.A.ravel()
s = dat.obs['mol_hs'].values.ravel()
fits = dict()
for donor in dat.obs['chip_id'].unique():
  idx = dat.obs['chip_id'] == donor
  for m in ('point', 'gamma', 'point_gamma'):
    print(f'fitting {donor} ({m})')
    fits[(donor, m)] = getattr(scmodes.ebpm, f'ebpm_{m}')(x[idx], s[idx])[-1]
  for m in ('unimodal', 'npmle'):
    print(f'fitting {donor} ({m})')
    fits[(donor, m)] = getattr(scmodes.ebpm, f'ebpm_{m}')(x[idx], s[idx]).rx2('loglik')[0]
skp1_res = (fix_llik(pd.DataFrame(fits, index=[0]).T
                     .reset_index()
                     .pivot_table(index='level_0', columns='level_1', values=0))
            [['gamma', 'point_gamma', 'unimodal', 'npmle']])
skp1_res[skp1_res['point_gamma'] > skp1_res['gamma'] + np.log(100)].shape[0]
0
skp1_res[skp1_res['unimodal'] > skp1_res['gamma'] + np.log(100)].shape[0]
34
skp1_res[skp1_res['unimodal'] > skp1_res['point_gamma'] + np.log(100)].shape[0]
34
skp1_res[skp1_res['npmle'] > skp1_res['unimodal'] + np.log(100)]
level_1       gamma  point_gamma    unimodal       npmle
level_0
NA19116 -494.000236  -494.000236 -482.597503 -477.940124