Validation set log likelihood comparison
Table of Contents
Introduction
We find examples where ZIEF has better out-of-sample log likelihood than NPMLE. Investigate why this happens.
Setup
import numpy as np
import pandas as pd
import sklearn.model_selection as skms
import rpy2.robjects.packages
import rpy2.robjects.pandas2ri

rpy2.robjects.pandas2ri.activate()

ashr = rpy2.robjects.packages.importr('ashr')
descend = rpy2.robjects.packages.importr('descend')
%matplotlib inline
%config InlineBackend.figure_formats = set(['retina'])
import matplotlib.pyplot as plt
plt.rcParams['figure.facecolor'] = 'w'
Results
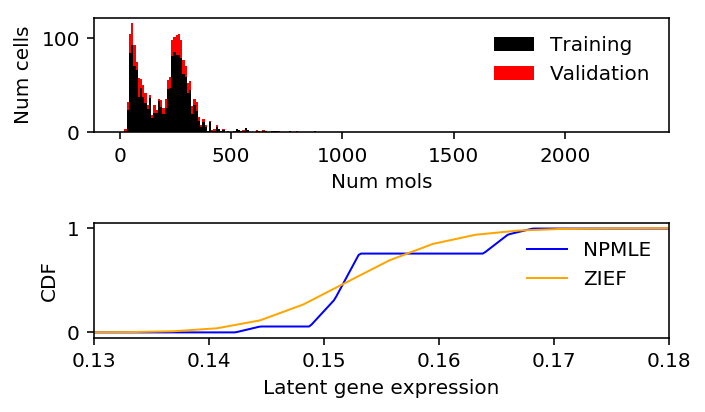
90/10 split
chromium2 = data['chromium2']()
query = benchmark['chromium2']['zief'] > benchmark['chromium2']['npmle']
x = chromium2[:,query][:,0]
s = chromium1.sum(axis=1)
train, val, train_s, val_s = skms.train_test_split(x, s, test_size=0.1, random_state=1)
train_lam = train / train_s
K = 100
grid = np.linspace(0, lam.max(), K + 1)
zief_res = descend.deconvSingle(train, scaling_consts=train_s, verbose=False)
npmle_res = ashr.ash_workhorse(
  pd.Series(np.zeros(train.shape)),
  1,
  outputlevel=pd.Series(['fitted_g', 'loglik']),
  lik=ashr.lik_pois(y=pd.Series(train), scale=pd.Series(train_s), link='identity'),
  g=ashr.unimix(pd.Series(np.ones(K) / K), pd.Series(grid[:-1]), pd.Series(grid[1:])))
npmle_val_res = ashr.ash_workhorse(
  pd.Series(np.zeros(val.shape)),
  1,
  outputlevel='loglik',
  lik=ashr.lik_pois(y=pd.Series(val), scale=pd.Series(val_s), link='identity'),
  fixg=True,
  g=npmle_res.rx2('fitted_g'))
zief_train_llik = np.where(train < 1,
                     np.log(st.poisson(mu=train_s.reshape(-1, 1) * zief_g[:,0]).pmf(train.reshape(-1, 1)).dot(zief_g[:,1])),
                     np.log(st.poisson(mu=train_s.reshape(-1, 1) * zief_g[1:,0]).pmf(train.reshape(-1, 1)).dot(zief_g[1:,1])))
npmle_train_llik = np.array(npmle_res.rx2('loglik'))


zief_val_llik = np.where(val < 1,
                     np.log(st.poisson(mu=val_s.reshape(-1, 1) * zief_g[:,0]).pmf(val.reshape(-1, 1)).dot(zief_g[:,1])),
                     np.log(st.poisson(mu=val_s.reshape(-1, 1) * zief_g[1:,0]).pmf(val.reshape(-1, 1)).dot(zief_g[1:,1])))
npmle_val_llik = np.array(npmle_val_res.rx2('loglik'))
zief_train_llik.sum() - npmle_train_llik.sum()
-6.1758928957397075
zief_val_llik.sum() - npmle_val_llik.sum()
0.4706860378236115
zief_g = np.array(zief_res.slots['distribution'])[:,:2]
zief_cdf = np.array([zief_g[:,0], np.cumsum(zief_g[:,1])])
npmle_cdf = ashr.cdf_ash(npmle_res, np.linspace(0, lam.max(), 1000))
plt.clf()
fig, ax = plt.subplots(2, 1)
fig.set_size_inches(5, 3)
h = ax[0].hist(train, bins=np.arange(0, x.max() + 1, 10), color='k', label='Training')
ax[0].hist(val, bottom=h[0], bins=np.arange(0, x.max() + 1, 10), color='r', label='Validation')
ax[0].legend(frameon=False)
ax[0].set_xlabel('Num mols')
ax[0].set_ylabel('Num cells')

ax[1].set_xlim(0.13, 0.18)
ax[1].plot(np.array(npmle_cdf.rx2('x')).ravel(), np.array(npmle_cdf.rx2('y')).ravel(), c='b', label='NPMLE', lw=1)
ax[1].plot(zief_cdf[0], zief_cdf[1], c='orange', label='ZIEF', lw=1)
ax[1].set_xlabel('Latent gene expression')
ax[1].set_ylabel('CDF')
ax[1].legend(frameon=False)

fig.tight_layout()
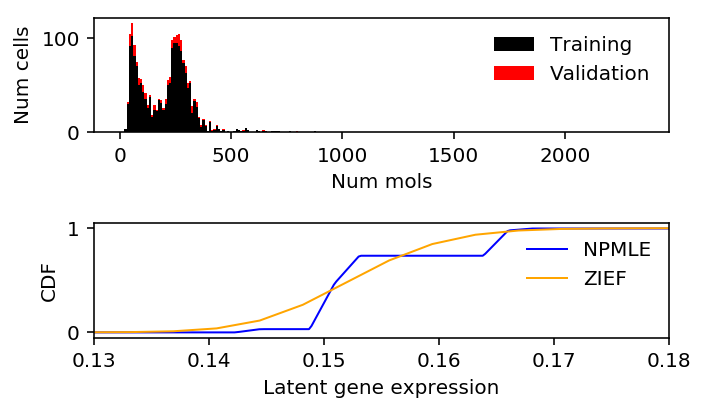
80/20 split
Repeat the analysis, holding out a larger validation set.
train, val, train_s, val_s = skms.train_test_split(x, s, test_size=0.2, random_state=1)
train_lam = train / train_s
K = 100
grid = np.linspace(0, lam.max(), K + 1)
zief_res = descend.deconvSingle(train, scaling_consts=train_s, verbose=False)
npmle_res = ashr.ash_workhorse(
  pd.Series(np.zeros(train.shape)),
  1,
  outputlevel=pd.Series(['fitted_g', 'loglik']),
  lik=ashr.lik_pois(y=pd.Series(train), scale=pd.Series(train_s), link='identity'),
  g=ashr.unimix(pd.Series(np.ones(K) / K), pd.Series(grid[:-1]), pd.Series(grid[1:])))
npmle_val_res = ashr.ash_workhorse(
  pd.Series(np.zeros(val.shape)),
  1,
  outputlevel='loglik',
  lik=ashr.lik_pois(y=pd.Series(val), scale=pd.Series(val_s), link='identity'),
  fixg=True,
  g=npmle_res.rx2('fitted_g'))
zief_train_llik = np.where(train < 1,
                     np.log(st.poisson(mu=train_s.reshape(-1, 1) * zief_g[:,0]).pmf(train.reshape(-1, 1)).dot(zief_g[:,1])),
                     np.log(st.poisson(mu=train_s.reshape(-1, 1) * zief_g[1:,0]).pmf(train.reshape(-1, 1)).dot(zief_g[1:,1])))
npmle_train_llik = np.array(npmle_res.rx2('loglik'))


zief_val_llik = np.where(val < 1,
                     np.log(st.poisson(mu=val_s.reshape(-1, 1) * zief_g[:,0]).pmf(val.reshape(-1, 1)).dot(zief_g[:,1])),
                     np.log(st.poisson(mu=val_s.reshape(-1, 1) * zief_g[1:,0]).pmf(val.reshape(-1, 1)).dot(zief_g[1:,1])))
npmle_val_llik = np.array(npmle_val_res.rx2('loglik'))
zief_train_llik.sum() - npmle_train_llik.sum()
-4.889467453983343
zief_val_llik.sum() - npmle_val_llik.sum()
-0.6343187388595197
zief_g = np.array(zief_res.slots['distribution'])[:,:2]
zief_cdf = np.array([zief_g[:,0], np.cumsum(zief_g[:,1])])
npmle_cdf = ashr.cdf_ash(npmle_res, np.linspace(0, lam.max(), 1000))
plt.clf()
fig, ax = plt.subplots(2, 1)
fig.set_size_inches(5, 3)
h = ax[0].hist(train, bins=np.arange(0, x.max() + 1, 10), color='k', label='Training')
ax[0].hist(val, bottom=h[0], bins=np.arange(0, x.max() + 1, 10), color='r', label='Validation')
ax[0].legend(frameon=False)
ax[0].set_xlabel('Num mols')
ax[0].set_ylabel('Num cells')

ax[1].set_xlim(0.13, 0.18)
ax[1].plot(np.array(npmle_cdf.rx2('x')).ravel(), np.array(npmle_cdf.rx2('y')).ravel(), c='b', label='NPMLE', lw=1)
ax[1].plot(zief_cdf[0], zief_cdf[1], c='orange', label='ZIEF', lw=1)
ax[1].set_xlabel('Latent gene expression')
ax[1].set_ylabel('CDF')
ax[1].legend(frameon=False)

fig.tight_layout()