Expression variation in human retina cells
Table of Contents
Introduction
Lukowski et al. 2019 generated a cell atlas of the human retina. Here, we study the prevalence of multi-modal expression variation in this data.
Setup
import anndata
import numpy as np
import pandas as pd
import scanpy as sc
import scipy.io as si
import scipy.sparse as ss
import scmodes
import scmodes.benchmark.gof
import scmodes.ebpm.sgd
import torch
%matplotlib inline
%config InlineBackend.figure_formats = set(['retina'])
import matplotlib.pyplot as plt
plt.rcParams['figure.facecolor'] = 'w'
plt.rcParams['font.family'] = 'Nimbus Sans'
Data
Read the data, and retain genes which have non-zero observations in at least 1% of cells.
prefix = '/project2/mstephens/aksarkar/projects/singlecell-ideas/data/human-cell-atlas/adult-retina/7f5e7a85-a45c-4535-90bf-0ef930a0040b.mtx'
counts = si.mmread(f'{prefix}/matrix.mtx.gz').tocsr()
# Important: the HCA metadata has a header, which breaks scmodes.dataset.read_10x
samples = pd.read_csv(f'{prefix}/cells.tsv.gz', sep='\t')
genes = pd.read_csv(f'{prefix}/genes.tsv.gz', sep='\t')
x = anndata.AnnData(counts.T, obs=samples, var=genes)
sc.pp.filter_genes(x, min_cells=.01 * x.shape[0])
x
AnnData object with n_obs × n_vars = 41350 × 11446
obs: 'cellkey', 'genes_detected', 'file_uuid', 'file_version', 'total_umis', 'emptydrops_is_cell', 'barcode', 'cell_suspension.provenance.document_id', 'specimen_from_organism.provenance.document_id', 'derived_organ_ontology', 'derived_organ_label', 'derived_organ_parts_ontology', 'derived_organ_parts_label', 'cell_suspension.genus_species.ontology', 'cell_suspension.genus_species.ontology_label', 'donor_organism.provenance.document_id', 'donor_organism.human_specific.ethnicity.ontology', 'donor_organism.human_specific.ethnicity.ontology_label', 'donor_organism.diseases.ontology', 'donor_organism.diseases.ontology_label', 'donor_organism.development_stage.ontology', 'donor_organism.development_stage.ontology_label', 'donor_organism.sex', 'donor_organism.is_living', 'specimen_from_organism.organ.ontology', 'specimen_from_organism.organ.ontology_label', 'specimen_from_organism.organ_parts.ontology', 'specimen_from_organism.organ_parts.ontology_label', 'library_preparation_protocol.provenance.document_id', 'library_preparation_protocol.input_nucleic_acid_molecule.ontology', 'library_preparation_protocol.input_nucleic_acid_molecule.ontology_label', 'library_preparation_protocol.library_construction_method.ontology', 'library_preparation_protocol.library_construction_method.ontology_label', 'library_preparation_protocol.end_bias', 'library_preparation_protocol.strand', 'project.provenance.document_id', 'project.project_core.project_short_name', 'project.project_core.project_title', 'analysis_protocol.provenance.document_id', 'dss_bundle_fqid', 'bundle_uuid', 'bundle_version', 'analysis_protocol.protocol_core.protocol_id', 'analysis_working_group_approval_status'
var: 'featurekey', 'featurename', 'featuretype', 'chromosome', 'featurestart', 'featureend', 'isgene', 'genus_species', 'n_cells'
Write the h5ad out.
x.write('/project2/mstephens/aksarkar/projects/singlecell-ideas/data/human-cell-atlas/adult-retina/adult-retina.h5ad')
Report the number of samples per donor.
x.obs['donor_organism.provenance.document_id'].value_counts()
427c0a62-9baf-42ab-a3a3-f48d10544280    21285
b8049daa-7458-47bf-8ec2-3f5c56d2cb34    16164
66b7152c-8e94-412b-b0e4-f8fbf554df5a     3901
Name: donor_organism.provenance.document_id, dtype: int64
Read the h5ad.
x = anndata.read_h5ad('/project2/mstephens/aksarkar/projects/singlecell-ideas/data/human-cell-atlas/adult-retina/adult-retina.h5ad')
Results
Gamma assumption
Fit a Gamma distribution to expression variation at each gene within the donor with maximum number of cells assayed.
query = x.obs['donor_organism.provenance.document_id'] == '427c0a62-9baf-42ab-a3a3-f48d10544280'
res = scmodes.ebpm.sgd.ebpm_gamma(x[query].X, batch_size=64, max_epochs=20, verbose=True)
Test GOF at each gene.
s = x[query].X.sum(axis=1).A.ravel()
gof_res = []
for j, (log_mu, neg_log_phi) in enumerate(np.vstack(res[:-1]).T):
  d, p = scmodes.benchmark.gof._gof(x=x[query,j].X.A.ravel(),
                                    cdf=scmodes.benchmark.gof._zig_cdf,
                                    pmf=scmodes.benchmark.gof._zig_pmf,
                                    size=s,
                                    log_mu=log_mu,
                                    log_phi=-neg_log_phi)
  gof_res.append([d, p])
gof_res = pd.DataFrame(gof_res, columns=['stat', 'p'], index=x.var['featurename']).reset_index()
gof_res.to_csv('/project2/mstephens/aksarkar/projects/singlecell-modes/data/gof/adult-retina-gamma.txt.gz', sep='\t', compression='gzip')
Plot the histogram of GOF \(p\)-values.
plt.clf()
plt.gcf().set_size_inches(2, 2)
plt.hist(gof_res['p'], bins=np.linspace(0, 1, 11), color='0.7', density=True)
plt.axhline(y=1, lw=1, ls=':', c='k')
plt.xlim(0, 1)
plt.xlabel('$p$-value')
plt.ylabel('Density')
plt.tight_layout()
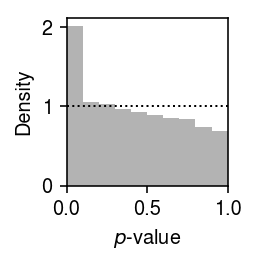
Report the fraction of genes which significantly depart from Gamma (Bonferroni-corrected \(p < 0.05\)).
sig = gof_res.loc[gof_res['p'] < 0.05 / gof_res.shape[0]]
sig.shape[0] / gof_res.shape[0]
0.020094356106936922
Point-Gamma assumption
Fit a point-Gamma distribution to expression variation at each gene.
res = scmodes.ebpm.sgd.ebpm_point_gamma(x[query].X, max_epochs=20, verbose=True)
Test GOF at each gene.
s = x[query].X.sum(axis=1).A.ravel()
result = []
for j, (log_mu, neg_log_phi, logodds) in enumerate(np.vstack(res[:3]).T):
  d, p = scmodes.benchmark.gof._gof(x=x[query,j].X.A.ravel(),
                                    cdf=scmodes.benchmark.gof._zig_cdf,
                                    pmf=scmodes.benchmark.gof._zig_pmf,
                                    size=s,
                                    log_mu=log_mu,
                                    log_phi=-neg_log_phi,
                                    logodds=logodds)
  result.append([d, p])
result = pd.DataFrame(result, columns=['stat', 'p'], index=x.var['featurename']).reset_index()
result.to_csv('/project2/mstephens/aksarkar/projects/singlecell-modes/data/gof/retina-point-gamma.txt.gz', sep='\t', compression='gzip')
Plot the histogram of GOF \(p\)-values.
plt.clf()
plt.gcf().set_size_inches(2, 2)
plt.hist(result['p'], bins=np.linspace(0, 1, 11), color='0.7', density=True)
plt.axhline(y=1, lw=1, ls=':', c='k')
plt.xlim(0, 1)
plt.xlabel('$p$-value')
plt.ylabel('Density')
plt.tight_layout()
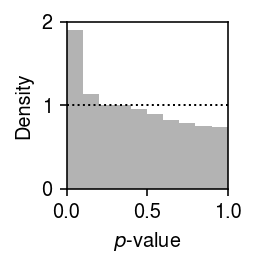
Report the fraction of genes which significantly depart from point-Gamma (Bonferroni-corrected \(p < 0.05\)).
sig = result.loc[result['p'] < 0.05 / result.shape[0]]
sig.shape[0] / result.shape[0]
0.01712388607373755
Write out the significant genes.
x.obs['size'] = x.X.sum(axis=1)
x[query,sig.index].write('/scratch/midway2/aksarkar/modes/unimodal-data/retina.h5ad')
Unimodal assumption
Fit a unimodal distribution to expression variation at each gene which departed significantly from a point-Gamma assumption.
sbatch --partition=broadwl -n1 -c28 --exclusive --time=12:00:00 --job-name=gof
#!/bin/bash
source activate scmodes
python <<EOF
import anndata
import multiprocessing as mp
import pandas as pd
import scmodes
with mp.Pool(maxtasksperchild=20) as pool:
  x = anndata.read('/scratch/midway2/aksarkar/modes/unimodal-data/retina.h5ad')
  res = scmodes.benchmark.evaluate_gof(pd.DataFrame(x.X.A), s=x.obs['size'], pool=pool,
                                       methods=['unimodal'])
  res.index = x.var['featurename']
  res.to_csv(f'/project2/mstephens/aksarkar/projects/singlecell-modes/data/gof/retina-unimodal.txt.gz', compression='gzip', sep='\t')
EOF
Read the results.
unimodal_res = pd.read_csv('/project2/mstephens/aksarkar/projects/singlecell-modes/data/gof/retina-unimodal.txt.gz', sep='\t', index_col=0)
Plot the histogram of GOF \(p\)-values.
plt.clf()
plt.gcf().set_size_inches(2, 2)
plt.hist(unimodal_res['p'], bins=np.linspace(0, 1, 11), color='0.7', density=True)
plt.axhline(y=1, lw=1, ls=':', c='k')
plt.xlim(0, 1)
plt.xlabel('$p$-value')
plt.ylabel('Density')
plt.tight_layout()
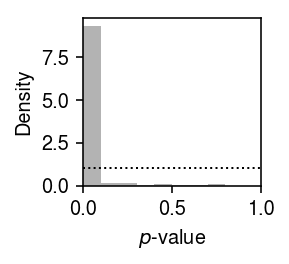
Report the number and fraction of genes which depart from a unimodal assumption.
sig = unimodal_res.loc[unimodal_res['p'] < .05 / unimodal_res.shape[0]]
sig.shape[0], sig.shape[0] / x.shape[1]
(124, 0.010833478944609471)