MLCB figures
Table of Contents
Introduction
Draw examples for MLCB submission.
Setup
import numpy as np
import pandas as pd
import scipy.special as sp
import scipy.stats as st
import scmodes
import sqlite3
%matplotlib inline
%config InlineBackend.figure_formats = set(['retina'])
import matplotlib.pyplot as plt
plt.rcParams['figure.facecolor'] = 'w'
plt.rcParams['font.family'] = 'Nimbus Sans'
Results
MLCB plots
Plot the iPSC examples.
ipsc_res = pd.read_csv('/project2/mstephens/aksarkar/projects/singlecell-modes/data/deconv-generalization/ipsc-gpu.txt.gz', index_col=0, sep='\t')
lrt = st.chi2(1).sf(-2 * (ipsc_res['gamma'] - ipsc_res['point_gamma']))
query = list(ipsc_res[lrt < .05 / lrt.shape[0]].index)

# SKP1: top eQTL
query.append('ENSG00000113558')
ipsc_counts = scmodes.dataset.ipsc(prefix='/project2/mstephens/aksarkar/projects/singlecell-qtl/data/',
                                   query=query, return_df=True)
annotation = pd.read_csv('/project2/mstephens/aksarkar/projects/singlecell-qtl/data/scqtl-annotation.txt', sep='\t')
keep_samples = pd.read_csv('/project2/mstephens/aksarkar/projects/singlecell-qtl/data/quality-single-cells.txt', index_col=0, header=None, sep='\t')
annotation = annotation.loc[keep_samples.values.ravel()]
s = annotation['mol_hs']
donor_info = pd.read_csv('/project2/mstephens/aksarkar/projects/singlecell-modes/data/20130606_sample_info.txt', sep='\t')
ipsc_log_mu = pd.read_csv('/project2/mstephens/aksarkar/projects/singlecell-qtl/data/density-estimation/design1/zi2-log-mu.txt.gz', sep=' ', index_col=0)
ipsc_log_phi = pd.read_csv('/project2/mstephens/aksarkar/projects/singlecell-qtl/data/density-estimation/design1/zi2-log-phi.txt.gz', sep=' ', index_col=0)
ipsc_logodds = pd.read_csv('/project2/mstephens/aksarkar/projects/singlecell-qtl/data/density-estimation/design1/zi2-logodds.txt.gz', sep=' ', index_col=0)
del ipsc_log_mu['NA18498']
def point_gamma_cdf(grid, log_mu, log_phi, logodds):
  res = st.gamma(a=np.exp(-log_phi), scale=np.exp(log_mu + log_phi)).cdf(grid)
  res *= sp.expit(-logodds)
  res += sp.expit(logodds)
  return res

lam = ipsc_counts.values / s.values.reshape(-1, 1)
grid = np.linspace(lam.min(), lam.max(), 1000)
cdfs = np.array([[point_gamma_cdf(grid,
                                  ipsc_log_mu.loc[j, k],
                                  ipsc_log_phi.loc[j, k],
                                  ipsc_logodds.loc[j, k])
                  for k in ipsc_log_mu]
                 for j in ipsc_counts.columns])
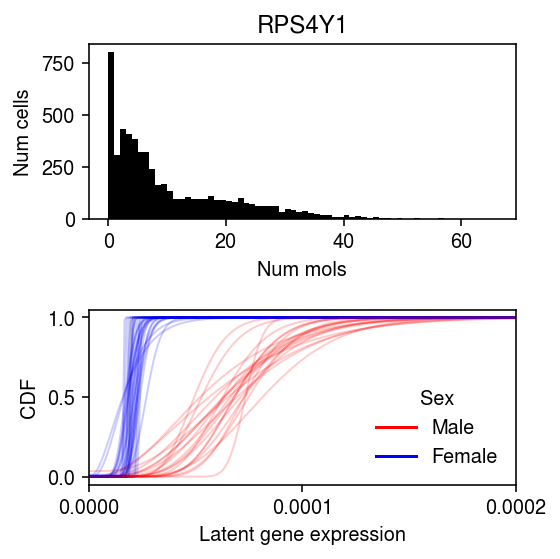
gene_info = pd.read_csv('/project2/mstephens/aksarkar/projects/singlecell-qtl/data/scqtl-genes.txt.gz', sep='\t', index_col=0)
colors = {k: 'r' if v == 'male' else 'b' for k, v in
          donor_info.set_index('Sample')
          .filter(items=list(ipsc_log_mu.columns), axis=0)
          ['Gender']
          .iteritems()}
k = 'ENSG00000129824'
x = ipsc_counts.loc[:,k].values
plt.clf()
fig, ax = plt.subplots(2, 1)
fig.set_size_inches(4, 4)

ax[0].hist(x, bins=np.arange(x.max() + 1), color='k')
ax[0].set_title(gene_info.loc[k, 'name'])
ax[0].set_xlabel('Num mols')
ax[0].set_ylabel('Num cells')

for f, k in zip(cdfs[2], ipsc_log_mu.columns):
  ax[1].plot(grid, f, lw=1, alpha=0.2, c=colors.get(k, 'k'))
ax[1].set_xlim(0, 2e-4)
ax[1].set_xticks(np.linspace(0, 2e-4, 3))
dummy = [plt.Line2D([0], [0], c='r'), plt.Line2D([0], [0], c='b')]
ax[1].legend(dummy, ['Male', 'Female'], title='Sex', frameon=False)
ax[1].set_ylabel('CDF')
ax[1].set_xlabel('Latent gene expression')

fig.tight_layout()
mean_qtl_stats = pd.read_csv('/project2/mstephens/aksarkar/projects/singlecell-qtl/data/scqtl-mapping/zinb/mean.txt.gz', sep=' ', index_col=0)
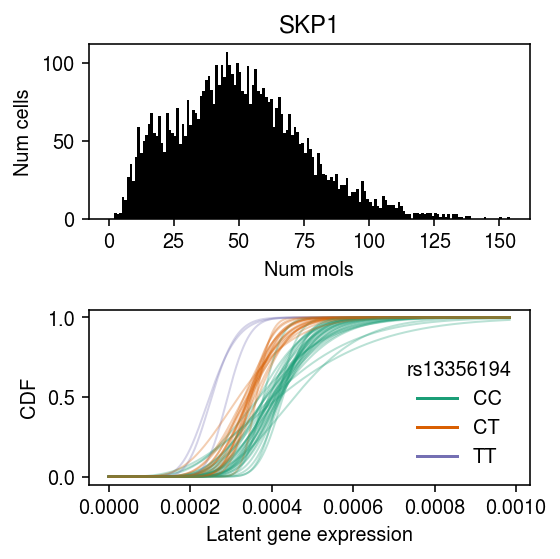
with sqlite3.connect('/project2/mstephens/aksarkar/projects/singlecell-qtl/browser/browser.db') as conn:
  geno = pd.read_sql('select * from mean_qtl_geno where gene = ?', con=conn, params=('ENSG00000113558',)).set_index('ind')['value']
cm = plt.get_cmap('Dark2')
k = 'ENSG00000113558'
x = ipsc_counts.loc[:,k].values
plt.clf()
fig, ax = plt.subplots(2, 1)
fig.set_size_inches(4, 4)

ax[0].hist(x, bins=np.arange(x.max() + 1), color='k')
ax[0].set_title(gene_info.loc[k, 'name'])
ax[0].set_xlabel('Num mols')
ax[0].set_ylabel('Num cells')

for f, k in zip(cdfs[1], ipsc_log_mu.columns):
  ax[1].plot(grid, f, lw=1, alpha=0.3, c=cm(int(geno[k])))
dummy = [plt.Line2D([0], [0], c=cm(i)) for i in range(3)]
# https://www.ncbi.nlm.nih.gov/snp/?term=rs13356194
ax[1].legend(dummy, ['CC', 'CT', 'TT'], title=mean_qtl_stats.loc['ENSG00000113558', 'id'].split('.')[0], frameon=False)
ax[1].set_ylabel('CDF')
ax[1].set_xlabel('Latent gene expression')

fig.tight_layout()
Vector format
%config InlineBackend.figure_formats = set(['svg'])
plt.clf()
fig, ax = plt.subplots(1, len(results), sharey=True)
fig.set_size_inches(8, 2)
for a, k, t in zip(ax, results, titles):
  llik = results[k]['validation']
  for x, m in enumerate(llik):
    a.scatter(x + np.random.normal(scale=0.1, size=llik.shape[0]), llik[m].values, s=1, c='k', zorder=3)
  a.grid(c='0.8', lw=1, axis='x')
  a.set_xlim(-0.5, 2.5)
  a.set_xticks(np.arange(3))
  a.set_xticklabels([m.upper() for m in methods], rotation=90)
  a.set_title(t)
ax[0].set_ylabel('Validation log lik')
fig.tight_layout()
k = 'ENSG00000129824'
x = ipsc_counts.loc[:,k].values
plt.clf()
fig, ax = plt.subplots(2, 1)
fig.set_size_inches(4, 4)

ax[0].hist(x, bins=np.arange(x.max() + 1), color='k')
ax[0].set_title(gene_info.loc[k, 'name'])
ax[0].set_xlabel('Num mols')
ax[0].set_ylabel('Num cells')

for f, k in zip(cdfs[2], ipsc_log_mu.columns):
  ax[1].plot(grid, f, lw=1, alpha=0.2, c=colors.get(k, 'k'))
ax[1].set_xlim(0, 2e-4)
ax[1].set_xticks(np.linspace(0, 2e-4, 3))
dummy = [plt.Line2D([0], [0], c='r'), plt.Line2D([0], [0], c='b')]
ax[1].legend(dummy, ['Male', 'Female'], title='Sex', frameon=False)
ax[1].set_ylabel('CDF')
ax[1].set_xlabel('Latent gene expression')

fig.tight_layout()
cm = plt.get_cmap('Dark2')
k = 'ENSG00000113558'
x = ipsc_counts.loc[:,k].values
plt.clf()
fig, ax = plt.subplots(2, 1)
fig.set_size_inches(4, 4)

ax[0].hist(x, bins=np.arange(x.max() + 1), color='k')
ax[0].set_title(gene_info.loc[k, 'name'])
ax[0].set_xlabel('Num mols')
ax[0].set_ylabel('Num cells')

for f, k in zip(cdfs[1], ipsc_log_mu.columns):
  ax[1].plot(grid, f, lw=1, alpha=0.3, c=cm(int(geno[k])))
dummy = [plt.Line2D([0], [0], c=cm(i)) for i in range(3)]
# https://www.ncbi.nlm.nih.gov/snp/?term=rs13356194
ax[1].legend(dummy, ['CC', 'CT', 'TT'], title=mean_qtl_stats.loc['ENSG00000113558', 'id'].split('.')[0], frameon=False)
ax[1].set_ylabel('CDF')
ax[1].set_xlabel('Latent gene expression')

fig.tight_layout()
cytotoxic_t = scmodes.dataset.read_10x('/project2/mstephens/aksarkar/projects/singlecell-ideas/data/10xgenomics/cytotoxic_t/filtered_matrices_mex/hg19/', return_df=True)
k = 'ENSG00000109475'
x = cytotoxic_t.loc[:,k]
s = cytotoxic_t.sum(axis=1)

plt.clf()
fig, ax = plt.subplots(2, 1)
fig.set_size_inches(4, 4)
ax[0].hist(x, bins=np.arange(x.max() + 1), color='k')
ax[0].set_title(gene_info.loc[k, 'name'])
ax[0].set_xlabel('Num mols')
ax[0].set_ylabel('Num cells')

for c, k in zip(plt.get_cmap('Dark2').colors, ['Gamma', 'ZIG', 'Unimodal', 'ZIEF', 'NPMLE']):
  ax[1].plot(*getattr(scmodes.deconvolve, f'fit_{k.lower()}')(x, s), color=c, lw=1, label=k)
ax[1].set_xlabel('Latent gene expression')
ax[1].set_ylabel('CDF')
ax[1].legend(frameon=False)
fig.tight_layout()
Poster figures
%config InlineBackend.figure_formats = set(['svg'])
data = ['cytotoxic_t', 'b_cells', 'naive_t', 'cytotoxic_t-b_cells', 'cytotoxic_t-naive_t', 'pbmcs_68k']
methods = ['nmf', 'wglmpca', 'pvae']
titles = ['B cell', 'Cytotoxic T', 'Naive T', 'B cell/T cell', 'Naive/cytotoxic T', 'PBMC']
poisthin_res = pd.concat(
  {k: pd.concat([pd.read_csv(f'/project2/mstephens/aksarkar/projects/singlecell-modes/data/lra-generalization/{k}-{m}.txt.gz', header=[0, 1], index_col=0, sep='\t') for m in methods if not (k == 'pbmcs_68k' and m == 'wglmpca')], axis=1) for k in data})

plt.clf()
fig, ax = plt.subplots(2, 3, sharex=True)
fig.set_size_inches(5, 4)
for a, k, t in zip(ax.ravel(), data, titles):
  llik = poisthin_res.loc[k]['validation']
  for x, m in enumerate(llik):
    a.scatter(x + np.random.normal(scale=0.1, size=llik.shape[0]), llik[m].values, s=1, c='k', zorder=3)
  a.grid(c='0.8', lw=1, axis='x')
  a.set_xlim(-0.5, 2.5)
  a.set_xticks(np.arange(3))
  a.set_title(t)
for a in ax[-1]:
  a.set_xlabel('Method')
  a.set_xticklabels([m.upper() for m in llik.columns], rotation=90)
for a in ax:
  a[0].set_ylabel('Validation log lik')
fig.tight_layout()
data = ['cytotoxic_t', 'b_cells', 'ipsc', 'cytotoxic_t-b_cells', 'cytotoxic_t-naive_t', 'pbmcs_68k']
methods = ['oracle', 'ebpm_point', 'wnmf', 'wglmpca']
imputation_res = (pd.concat({(d, m): pd.read_csv(f'/project2/mstephens/aksarkar/projects/singlecell-modes/data/imputation/{d}-{m}.txt.gz', sep='\t', index_col=0)
                                 for d in data for m in methods if d != 'naive_t'})
                  .reset_index(level=0)
                  .reset_index(drop=True)
                  .rename({'level_0': 'dataset'}, axis=1))

plt.clf()
fig, ax = plt.subplots(2, 3, sharex=True)
fig.set_size_inches(5, 4)
for a, d, t in zip(ax.ravel(), data, ['T cells', 'B cells', 'iPSC', 'T cell/B cell', 'Cytotoxic/naive T', 'PBMC']):
  g = imputation_res[imputation_res['dataset'] == d]
  base = g.loc[g['method'] == 'ebpm_point']
  for x, m in enumerate(methods[2:]):
    y = g.loc[g['method'] == m]
    a.scatter(x + np.random.normal(size=y.shape[0], scale=0.1),
              1e5 * (base['loss'].values - y['loss'].values), s=2, c='k', zorder=4)
  a.axhline(y=0, c='r', lw=1, ls=':')
  a.set_title(t)
  a.grid(c='0.8', lw=1, axis='x')
for a in ax[-1]:
  a.set_xticks(np.arange(2))
  a.set_xticklabels([m.upper() for m in methods[2:]], rotation=90)
  a.set_xlabel('Method')
a = fig.add_subplot(111, frameon=False)
a.tick_params(labelcolor='none', top='off', bottom='off', left='off', right='off')
a.set_ylabel('Improvement in Poisson loss\nover mean imputation')
fig.tight_layout()
gof_res = pd.read_csv('/project2/mstephens/aksarkar/projects/singlecell-modes/data/gof/gof.txt.gz', sep='\t', index_col=0)
plt.clf()
fig, ax = plt.subplots(1, 6, sharey=True)
fig.set_size_inches(8, 2)
for a, t, (k, g) in zip(ax.ravel(),
                        ['T cell', 'B cell', 'iPSC', 'T cell/B cell', 'Cytotoxic/naive T', 'PBMC'],
                        gof_res.groupby('dataset')):
  a.hist(g.loc[g['method'] == 'gamma', 'p'], bins=np.linspace(0, 1, 11), color='0.7', density=True)
  a.axhline(y=1, c='k', ls=':', lw=1)
  a.set_xlim([0, 1])
  a.set_title(t)
ax[0].set_ylabel('Density')
for a in ax:
  a.set_xlabel('$p$-value')
fig.tight_layout()