Low rank approximation
Table of Contents
Introduction
The key idea of our approach to modeling scRNA-seq is to separate sampling variation and expression variation. This approach leads to the following multi-gene model for scRNA-seq data: \( \newcommand\ml{\mathbf{L}} \newcommand\mf{\mathbf{F}} \newcommand\my{\mathbf{Y}} \)
\begin{align*} x_{ij} &\sim \operatorname{Poisson}(\lambda_{ij})\\ \lambda_{ij} &= h^{-1}((\ml\mf')_{ij}) \end{align*}where \(i = 1, \ldots, n\), \(j = 1, \ldots, p\), \(\ml\) is an \(n \times K\) matrix, and \(\mf\) is a \(p \times K\) matrix. (Here, we absorb the size factor into \(\ml\).) A number of methods have been proposed to fit this model (or extensions to it), several specialized for scRNA-seq data.
- Non-negative matrix factorization (Lee and Seung 2001, Févotte and Idier 2011)
- Negative Binomial Matrix Factorization (Gouvert et al. 2018)
- Latent dirichlet allocation (Blei et al 2003, Hoffman et al. 2010, Taddy 2012)
- Hierarchical Bayesian Poisson Factorization (Cemgil 2009, Gopalan et al. 2015, Levitin et al. 2019)
- ZINB-WAVE (Risso et al. 2018)
- scVI (Lopez et al. 2018)
- DCA (Eraslan et al. 2019)
- GLM-PCA (Townes et al. 2019)
Here, we evaluate methods on their ability to estimate \(\lambda\). We use Poisson thinning (Gerard and Stephens 2017, Gerard 2019) of real data
\begin{align*} x_{ij} &\sim \mathrm{Poisson}(\lambda_{ij})\\ y_{ij} &\sim \mathrm{Binomial}(x_{ij}, 0.5)\\ \tilde{y}_{ij} &= x_{ij} - y_{ij} \end{align*}resulting in two matrices \(\my\) and \(\tilde{\my}\) with identical \(\lambda\). Our benchmark estimates \(\ml, \mf\) from \(\my\) and evaluates the estimate using the log likelihood of \(\tilde{\my}\).
Setup
import anndata
import collections
import numpy as np
import os.path
import pandas as pd
import scanpy as sc
import scmodes
%matplotlib inline
%config InlineBackend.figure_formats = set(['retina'])
import colorcet
import matplotlib.pyplot as plt
plt.rcParams['figure.facecolor'] = 'w'
plt.rcParams['font.family'] = 'Nimbus Sans'
Results
Datasets
Take genes with non-zero counts present in at least 25% of cells. In the iPSC data, this is all 9,957 genes, so take a random sample of 500 genes.
def _read_10x(k, min_detect=0.25, n_cells=1000, seed=1):
  return scmodes.dataset.read_10x(f'/project2/mstephens/aksarkar/projects/singlecell-ideas/data/10xgenomics/{k}/filtered_matrices_mex/hg19/', min_detect=0.25, return_df=True).sample(n=n_cells, axis=0, random_state=seed)

def _mix_10x(k1, k2, min_detect=0.25, n_cells=1000, seed=1):
  x1 = scmodes.dataset.read_10x(f'/project2/mstephens/aksarkar/projects/singlecell-ideas/data/10xgenomics/{k1}/filtered_matrices_mex/hg19/', return_df=True, min_detect=0)
  x2 = scmodes.dataset.read_10x(f'/project2/mstephens/aksarkar/projects/singlecell-ideas/data/10xgenomics/{k2}/filtered_matrices_mex/hg19/', return_df=True, min_detect=0)
  return scmodes.dataset.synthetic_mix(x1, x2, min_detect=min_detect)[0].sample(n=n_cells, axis=0, random_state=seed)

def _cd8_cd19_mix(**kwargs):
  return _mix_10x('cytotoxic_t', 'b_cells', **kwargs)

def _cyto_naive_mix(**kwargs):
  return _mix_10x('cytotoxic_t', 'naive_t', **kwargs)

def read_liver(min_detect=0.25, n_cells=1000, seed=1):
  x = anndata.read_h5ad('/project2/mstephens/aksarkar/projects/singlecell-ideas/data/human-cell-atlas/liver-caudate-lobe/liver-caudate-lobe.h5ad')
  sc.pp.filter_genes(x, min_counts=min_detect * x.shape[0])
  sc.pp.subsample(x, n_obs=n_cells, random_state=seed)
  return x.X

def read_kidney(min_detect=0.25, n_cells=1000, n_genes=500, seed=1):
  x = anndata.read_h5ad('/project2/mstephens/aksarkar/projects/singlecell-ideas/data/human-cell-atlas/kidney/kidney.h5ad')
  sc.pp.filter_genes(x, min_counts=min_detect * x.shape[0])
  sc.pp.subsample(x, n_obs=n_cells, random_state=seed)
  return x.X[:,np.random.choice(x.shape[1], size=n_genes)]

def read_brain(min_detect=0.25, n_cells=1000, seed=1):
  x = anndata.read_h5ad('/project2/mstephens/aksarkar/projects/singlecell-ideas/data/gtex-droncseq/gtex-droncseq.h5ad')
  sc.pp.filter_genes(x, min_counts=min_detect * x.shape[0])
  sc.pp.subsample(x, n_obs=n_cells, random_state=seed)
  return x.X

def read_retina(min_detect=0.25, n_cells=1000, seed=1):
  x = anndata.read_h5ad('/project2/mstephens/aksarkar/projects/singlecell-ideas/data/human-cell-atlas/adult-retina/adult-retina.h5ad')
  query = x.obs['donor_organism.provenance.document_id'] == '427c0a62-9baf-42ab-a3a3-f48d10544280'
  y = x[query]
  sc.pp.filter_genes(y, min_cells=min_detect * y.shape[0])
  sc.pp.subsample(y, n_obs=n_cells, random_state=seed)
  return y.X

def read_pbmc_10k_v3(min_detect=0.25, n_cells=1000, n_genes=500, seed=1):
  x = anndata.read_h5ad('/scratch/midway2/aksarkar/modes/10k_pbmc_v3.h5ad')
  sc.pp.filter_genes(x, min_counts=min_detect * x.shape[0])
  sc.pp.subsample(x, n_obs=n_cells, random_state=seed)
  return x.X[:,np.random.choice(x.shape[1], size=n_genes)]

data = {
  'cytotoxic_t': lambda: _read_10x('cytotoxic_t'),
  'b_cells': lambda: _read_10x('b_cells'),
  'ipsc': lambda: scmodes.dataset.ipsc('/project2/mstephens/aksarkar/projects/singlecell-qtl/data/', return_df=True).sample(n=1000, axis=0, random_state=1).sample(n=500, axis=1, random_state=2),
  'cytotoxic_t-b_cells': _cd8_cd19_mix,
  'cytotoxic_t-naive_t': _cyto_naive_mix,
  'kidney': read_kidney,
  'liver-caudate-lobe': read_liver,
  'pbmc_10k_v3': read_pbmc_10k_v3,
  'brain': read_brain,
  'retina': read_retina,
}
Report the data dimensions.
pd.DataFrame([data[k]().shape for k in data],
             columns=['num_cells', 'num_genes'],
             index=data.keys())
num_cells  num_genes
cytotoxic_t               1000        461
b_cells                   1000        375
ipsc                      1000        500
cytotoxic_t-b_cells       1000        404
cytotoxic_t-naive_t       1000        419
pbmc_10k_v3               1000        500
liver-caudate-lobe        1000        173
kidney                    1000        500
brain                     1000        430
retina                    1000        285
Report the proportion of zeros.
pd.Series({k: (data[k]() == 0).mean().mean() for k in data})
cytotoxic_t            0.437247
b_cells                0.416360
ipsc                   0.301654
cytotoxic_t-b_cells    0.430270
cytotoxic_t-naive_t    0.437422
pbmc_10k_v3            0.611776
liver-caudate-lobe     0.579526
kidney                 0.750420
brain                  0.719600
retina                 0.549053
dtype: float64
Poisson thinning benchmark
Run the CPU methods.
sbatch --partition=broadwl -n1 --mem=10G --time=24:00:00 --job-name=lra-generalization -a 41-79
#!/bin/bash
source activate scmodes
python <<EOF
<<imports>>
import os
<<data>>
ranks = [1, 2, 4, 8]
methods = ['nmf', 'glmpca']
tasks = [(d, m, r) for d in data for m in methods for r in ranks]
d, m, r = tasks[int(os.environ['SLURM_ARRAY_TASK_ID'])]
x = data[d]()
res = scmodes.benchmark.evaluate_lra_generalization(x, methods=[m], n_components=r, tol=1e-2, n_trials=5)
res.to_csv(f'/scratch/midway2/aksarkar/modes/lra-generalization/{d}-{m}-{r}.txt.gz', compression='gzip', sep='\t')
EOF
Run the GPU methods.
sbatch --partition=gpu2 --gres=gpu:1 --mem=16G --time=10:00 --job-name=lra-generalization -a 41-79%4
#!/bin/bash
source activate scmodes
python <<EOF
<<imports>>
import os
<<data>>
methods = ['pvae', 'nbvae']
ranks = [1, 2, 4, 8]
tasks = [(d, m, r) for d in data for m in methods for r in ranks]
d, m, r = tasks[int(os.environ['SLURM_ARRAY_TASK_ID'])]
x = data[d]()
res = scmodes.benchmark.evaluate_lra_generalization(x, methods=[m], n_components=r, n_trials=5)
res.to_csv(f'/scratch/midway2/aksarkar/modes/lra-generalization/{d}-{m}-{r}.txt.gz', compression='gzip', sep='\t')
EOF
Collect the results.
pois_thin_res = collections.defaultdict(list)
for k in data:
  for m in ('nmf', 'glmpca', 'pvae', 'nbvae'):
    for r in (1, 2, 4, 8):
      f = f'/scratch/midway2/aksarkar/modes/lra-generalization/{k}-{m}-{r}.txt.gz'
      if os.path.exists(f):
        pois_thin_res[(k, r)].append(pd.read_csv(f, header=[0, 1], index_col=0, sep='\t'))
pois_thin_res = pd.concat({k: pd.concat(pois_thin_res[k], axis=1) for k in pois_thin_res}, axis=0)
pois_thin_res.index.names = ['data', 'rank', 'trial']
pois_thin_res.to_csv('/project2/mstephens/aksarkar/projects/singlecell-modes/data/lra-generalization/lra-generalization.txt.gz', sep='\t')
Read the results.
pois_thin_res = pd.read_csv('/project2/mstephens/aksarkar/projects/singlecell-modes/data/lra-generalization/lra-generalization.txt.gz', sep='\t', header=[0, 1], index_col=[0, 1, 2])
Plot the results.
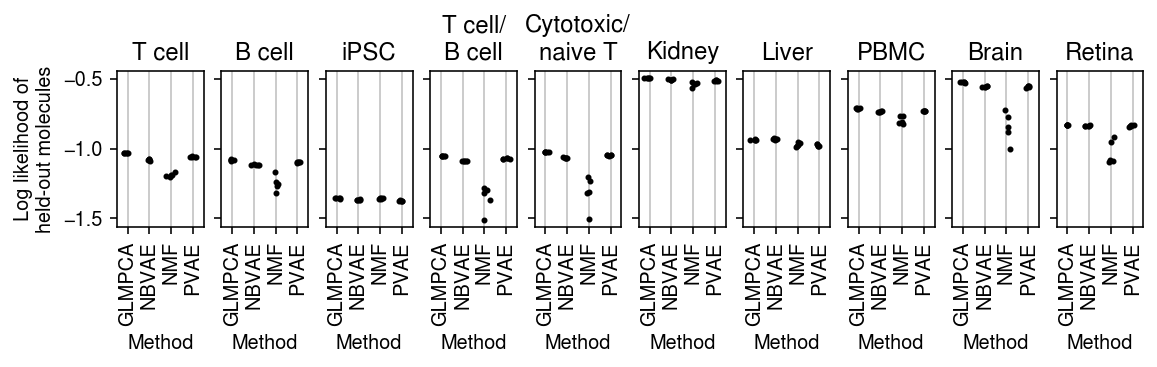
titles = ['T cell', 'B cell', 'iPSC', 'T cell/\nB cell', 'Cytotoxic/\nnaive T', 'Kidney', 'Liver', 'PBMC', 'Brain', 'Retina']
plt.clf()
fig, ax = plt.subplots(1, len(titles), sharey=True)
fig.set_size_inches(8, 2.5)
for a, (k, g), t in zip(ax.ravel(), pois_thin_res.xs(1, level=1)['validation'].groupby(level=0, sort=False), titles):
  for x, m in enumerate(g.columns):
    a.scatter(x + np.random.normal(scale=0.1, size=g.shape[0]), g[m].values, s=4, c='k', zorder=3)
  a.grid(c='0.8', lw=1, axis='x')
  a.set_xlim(-0.5, g.shape[1] - 0.5)
  a.set_xticks(np.arange(g.shape[1]))
  a.set_xticklabels([m.upper() for m in g.columns], rotation=90)
  a.set_xlabel('Method')
  a.set_title(t)
ax[0].set_ylabel('Log likelihood of\nheld-out molecules')
fig.tight_layout(pad=0.5)
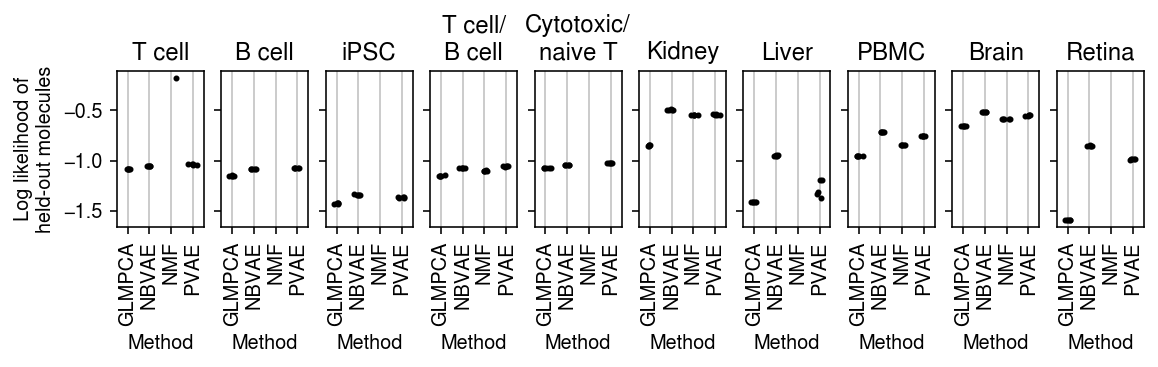
plt.clf()
fig, ax = plt.subplots(1, len(titles), sharey=True)
fig.set_size_inches(8, 2.5)
for a, (k, g), t in zip(ax.ravel(), pois_thin_res.xs(2, level=1)['validation'].groupby(level=0, sort=False), titles):
  for x, m in enumerate(g.columns):
    a.scatter(x + np.random.normal(scale=0.1, size=g.shape[0]), g[m].values, s=4, c='k', zorder=3)
  a.grid(c='0.8', lw=1, axis='x')
  a.set_xlim(-0.5, g.shape[1] - 0.5)
  a.set_xticks(np.arange(g.shape[1]))
  a.set_xticklabels([m.upper() for m in g.columns], rotation=90)
  a.set_xlabel('Method')
  a.set_title(t)
ax[0].set_ylabel('Log likelihood of\nheld-out molecules')
fig.tight_layout(pad=0.5)
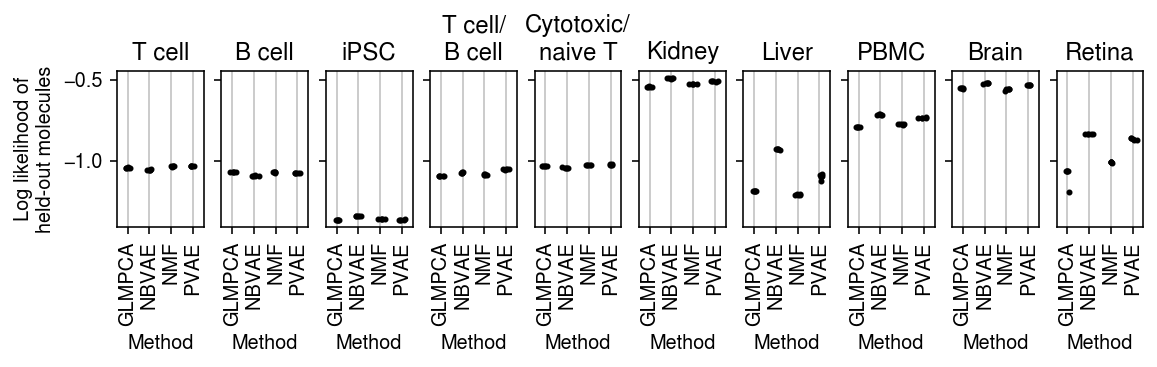
plt.clf()
fig, ax = plt.subplots(1, len(titles), sharey=True)
fig.set_size_inches(8, 2.5)
for a, (k, g), t in zip(ax.ravel(), pois_thin_res.xs(4, level=1)['validation'].groupby(level=0, sort=False), titles):
  for x, m in enumerate(g.columns):
    a.scatter(x + np.random.normal(scale=0.1, size=g.shape[0]), g[m].values, s=4, c='k', zorder=3)
  a.grid(c='0.8', lw=1, axis='x')
  a.set_xlim(-0.5, g.shape[1] - 0.5)
  a.set_xticks(np.arange(g.shape[1]))
  a.set_xticklabels([m.upper() for m in g.columns], rotation=90)
  a.set_xlabel('Method')
  a.set_title(t)
ax[0].set_ylabel('Log likelihood of\nheld-out molecules')
fig.tight_layout(pad=0.5)

plt.clf()
fig, ax = plt.subplots(1, len(titles), sharey=True)
fig.set_size_inches(8, 2.5)
for a, (k, g), t in zip(ax.ravel(), pois_thin_res.xs(8, level=1)['validation'].groupby(level=0, sort=False), titles):
  for x, m in enumerate(g.columns):
    a.scatter(x + np.random.normal(scale=0.1, size=g.shape[0]), g[m].values, s=4, c='k', zorder=3)
  a.grid(c='0.8', lw=1, axis='x')
  a.set_xlim(-0.5, g.shape[1] - 0.5)
  a.set_xticks(np.arange(g.shape[1]))
  a.set_xticklabels([m.upper() for m in g.columns], rotation=90)
  a.set_xlabel('Method')
  a.set_title(t)
ax[0].set_ylabel('Log likelihood of\nheld-out molecules')
fig.tight_layout(pad=0.5)