Expression variation in human brain cells
Table of Contents
Introduction
Habib et al. 2017 performed DroNc-Seq on GTEx brain tissues. Here, we study the prevalence of multi-modal expression variation in this data.
Setup
import anndata
import numpy as np
import pandas as pd
import scanpy
import scipy.sparse as ss
import scmodes
import scmodes.ebpm.sgd
import torch
%matplotlib inline
%config InlineBackend.figure_formats = set(['retina'])
import matplotlib.pyplot as plt
plt.rcParams['figure.facecolor'] = 'w'
plt.rcParams['font.family'] = 'Nimbus Sans'
Data
Read the data.
x = pd.read_csv('/project2/mstephens/aksarkar/projects/singlecell-ideas/data/gtex-droncseq/GTEx_droncseq_hip_pcf/GTEx_droncseq_hip_pcf.umi_counts.txt.gz', sep='\t', index_col=0)
Report the sparsity.
(x.values == 0).mean()
0.9794958734883428
Convert to
CSC,
and write to h5ad.
d = anndata.AnnData(
  ss.csc_matrix(x.values.T),
  obs=x.columns.to_frame().reset_index(drop=True).rename({0: 'barcode'}, axis=1),
  var=x.index.to_frame().reset_index(drop=True).rename({0: 'gene'}, axis=1),
)
d.write('/project2/mstephens/aksarkar/projects/singlecell-ideas/data/gtex-droncseq/gtex-droncseq.h5ad')
Read the data. Keep genes with a non-zero count in at least 1% of cells.
x = anndata.read_h5ad('/project2/mstephens/aksarkar/projects/singlecell-ideas/data/gtex-droncseq/gtex-droncseq.h5ad')
scanpy.pp.filter_genes(x, min_counts=.01 * x.shape[0])
x.obs['size'] = x.X.sum(axis=1)
Report the number of cells and genes analyzed.
x.shape
(14963, 11744)
Results
Gamma assumption
Fit a Gamma distribution to expression variation at each gene.
res = scmodes.ebpm.sgd.ebpm_gamma(x.X, max_epochs=15, verbose=True)
Test GOF at each gene.
import scmodes.benchmark.gof

s = x.X.sum(axis=1).A.ravel()
gof_res = []
for j, (log_mu, neg_log_phi) in enumerate(np.vstack(res[:-1]).T):
  d, p = scmodes.benchmark.gof._gof(x=x.X[:,j].A.ravel(),
                                    cdf=scmodes.benchmark.gof._zig_cdf,
                                    pmf=scmodes.benchmark.gof._zig_pmf,
                                    size=s,
                                    log_mu=log_mu,
                                    log_phi=-neg_log_phi)
  gof_res.append([d, p])
gof_res = pd.DataFrame(gof_res, columns=['stat', 'p'], index=x.var['gene']).reset_index()
Plot the histogram of GOF \(p\)-values.
plt.clf()
plt.gcf().set_size_inches(2, 2)
plt.hist(gof_res['p'], bins=np.linspace(0, 1, 11), color='0.7', density=True)
plt.axhline(y=1, lw=1, ls=':', c='k')
plt.xlim(0, 1)
plt.xlabel('$p$-value')
plt.ylabel('Density')
plt.tight_layout()
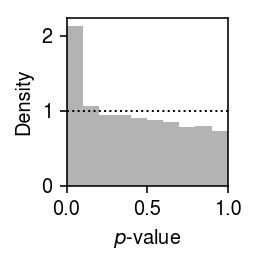
Report the fraction of genes which significantly depart from point-Gamma (Bonferroni-corrected \(p < 0.05\)).
sig = gof_res.loc[gof_res['p'] < 0.05 / gof_res.shape[0]]
sig.shape[0] / gof_res.shape[0]
0.025630108991825613
Write out the results.
gof_res.to_csv('/project2/mstephens/aksarkar/projects/singlecell-modes/data/gof/brain-dronc-seq-gamma.txt.gz', sep='\t', compression='gzip')
Point-Gamma assumption
Fit a point-Gamma distribution to expression variation at each gene.
res = scmodes.ebpm.sgd.ebpm_point_gamma(x.X, max_epochs=20, verbose=True)
Test GOF at each gene.
import scmodes.benchmark.gof

s = x.X.sum(axis=1).A.ravel()
result = []
for j, (log_mu, log_phi, logodds) in enumerate(np.vstack(res[:3]).T):
  d, p = scmodes.benchmark.gof._gof(x=x.X[:,j].A.ravel(),
                                    cdf=scmodes.benchmark.gof._zig_cdf,
                                    pmf=scmodes.benchmark.gof._zig_pmf,
                                    size=s,
                                    log_mu=log_mu,
                                    log_phi=-log_phi,
                                    logodds=logodds)
  result.append([d, p])
result = pd.DataFrame(result, columns=['stat', 'p'], index=x.var['gene']).reset_index()
Plot the histogram of GOF \(p\)-values.
plt.clf()
plt.gcf().set_size_inches(2, 2)
plt.hist(result['p'], bins=np.linspace(0, 1, 11), color='0.7', density=True)
plt.axhline(y=1, lw=1, ls=':', c='k')
plt.xlim(0, 1)
plt.xlabel('$p$-value')
plt.ylabel('Density')
plt.tight_layout()
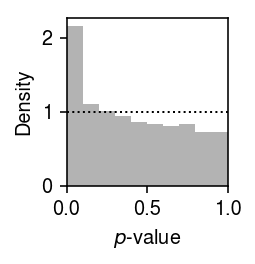
Report the fraction of genes which significantly depart from point-Gamma (Bonferroni-corrected \(p < 0.05\)).
sig = result.loc[result['p'] < 0.05 / result.shape[0]]
sig.shape[0] / result.shape[0]
0.025204359673024524
Write out the results.
result.to_csv('/project2/mstephens/aksarkar/projects/singlecell-modes/data/gof/brain-dronc-seq-gpu.txt.gz', sep='\t', compression='gzip')
Write out the significant genes.
x[:,sig.index].write('/scratch/midway2/aksarkar/modes/unimodal-data/brain-dronc-seq.h5ad')
Unimodal assumption
Fit a unimodal distribution to expression variation at each gene which departed significantly from a point-Gamma assumption.
sbatch --partition=broadwl -n1 -c28 --exclusive --time=12:00:00 --job-name=gof
#!/bin/bash
source activate scmodes
python <<EOF
import anndata
import multiprocessing as mp
import pandas as pd
import scmodes
with mp.Pool(maxtasksperchild=20) as pool:
  x = anndata.read('/scratch/midway2/aksarkar/modes/unimodal-data/brain-dronc-seq.h5ad')
  res = scmodes.benchmark.evaluate_gof(pd.DataFrame(x.X.A), s=x.obs['size'], pool=pool,
                                       methods=['unimodal'])
  res.index = x.var['gene']
  res.to_csv(f'/project2/mstephens/aksarkar/projects/singlecell-modes/data/gof/brain-dronc-seq-unimodal.txt.gz', compression='gzip', sep='\t')
EOF
Read the results.
unimodal_res = pd.read_csv('/project2/mstephens/aksarkar/projects/singlecell-modes/data/gof/brain-dronc-seq-unimodal.txt.gz', sep='\t', index_col=0)
Plot the histogram of GOF \(p\)-values.
plt.clf()
plt.gcf().set_size_inches(2, 2)
plt.hist(unimodal_res['p'], bins=np.linspace(0, 1, 11), color='0.7', density=True)
plt.axhline(y=1, lw=1, ls=':', c='k')
plt.xlim(0, 1)
plt.xlabel('$p$-value')
plt.ylabel('Density')
plt.tight_layout()
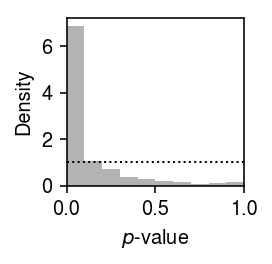
Report the number and fraction of genes which depart from a unimodal assumption.
sig = unimodal_res.loc[unimodal_res['p'] < .05 / unimodal_res.shape[0]]
sig.shape[0], sig.shape[0] / x.shape[1]
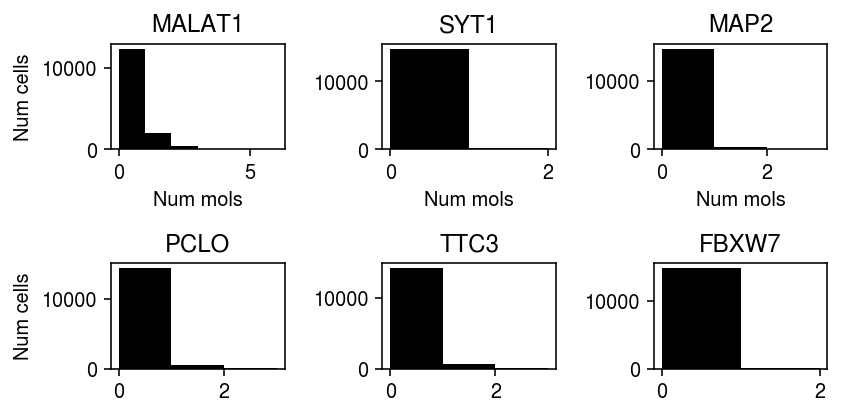
(62, 0.005279291553133515)
Plot the top 6 examples (by KS test statistic).
plt.clf()
fig, ax = plt.subplots(2, 3)
fig.set_size_inches(6, 3)
for a, k in zip(ax.ravel(), sig.sort_values('stat', ascending=False).index):
  xj = x.X[:,sig.loc[k, 'gene.1']].A.ravel()
  a.hist(xj, bins=np.arange(xj.max() + 1), color='k')
  a.set_title(k)
for a in ax:
  a[0].set_ylabel('Num cells')
for a in ax.T:
  a[0].set_xlabel('Num mols')
fig.tight_layout()
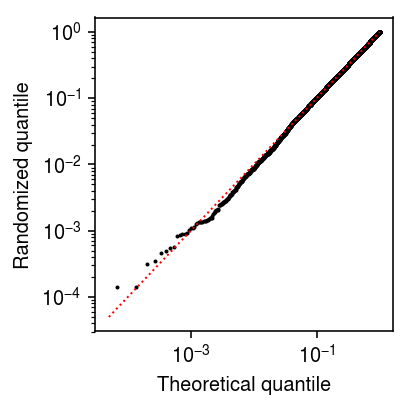
Plot randomized quantiles for MALAT1.
malat1_counts = x.X[:,np.where(x.var['gene'] == 'MALAT1')[0]].A.ravel()
s = x.obs['size'].values.ravel()
malat1_res = scmodes.ebpm.ebpm_unimodal(malat1_counts, s)
Fx = scmodes.benchmark.gof._ash_cdf(malat1_counts - 1, malat1_res, s=s)
fx = scmodes.benchmark.gof._ash_pmf(malat1_counts, malat1_res)
plt.clf()
plt.gcf().set_size_inches(3, 3)
plt.xscale('log')
plt.yscale('log')
plt.scatter(np.linspace(0, 1, malat1_counts.shape[0] + 2)[1:-1], np.sort(Fx + np.random.uniform(size=malat1_counts.shape[0]) * fx), s=1, c='k')
plt.plot([5e-5, 1], [5e-5, 1], lw=1, ls=':', c='r')
plt.xlabel('Theoretical quantile')
plt.ylabel('Randomized quantile')
plt.tight_layout()
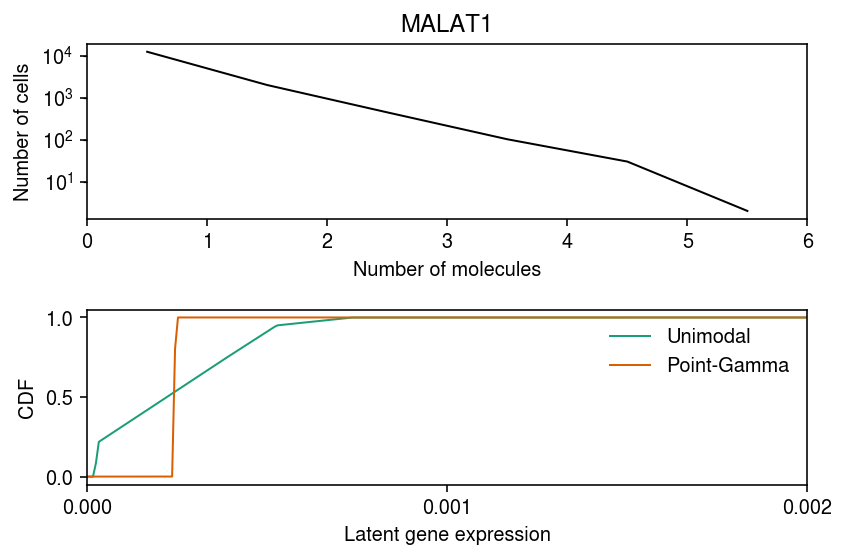
Plot the deconvolved distributions.
cm = plt.get_cmap('Dark2')
plt.clf()
fig, ax = plt.subplots(2, 1)
fig.set_size_inches(6, 4)
bins, edges = np.histogram(malat1_counts, bins=np.arange(malat1_counts.max() + 1))
ax[0].set_yscale('symlog')
ax[0].plot(edges[:-1] + .5, bins, lw=1, c='k')
ax[0].set_xlabel('Number of molecules')
ax[0].set_ylabel('Number of cells')
ax[0].set_xlim(0, malat1_counts.max())
ax[0].set_title('MALAT1')

for i, (m, t) in enumerate(zip(('unimodal', 'zig'), ('Unimodal', 'Point-Gamma'))):
  ax[1].plot(*getattr(scmodes.deconvolve, f'fit_{m}')(malat1_counts, x.obs['size'].values.ravel()), lw=1, c=cm(i), label=t)
ax[1].set_xlim(0, 2e-3)
ax[1].set_xticks(np.linspace(0, 2e-3, 3))
ax[1].set_xlabel('Latent gene expression')
ax[1].set_ylabel('CDF')
ax[1].legend(frameon=False)

fig.tight_layout()
Fit EBPM-Unimodal assuming a log link function.
eps = 1 / s.mean()
lam = malat1_counts / s
log_lam = np.log(lam + eps)
# V[ln(x + eps)] = E[ln(x + eps)^2] - (E[ln(x + eps)])^2; take 2nd order Taylor
# expansions and keep the 0th order term of the result
se_log_lam = np.sqrt(np.var(lam) / np.square(lam + eps))
malat1_log_link_res = scmodes.ebpm.ebpm_unimodal(
  malat1_counts,
  s,
  link='log',
  # Follow ashr::autoselect.mixsd
  mixsd=pd.Series(np.arange(.1 * se_log_lam.min(), 2 * np.sqrt((np.square(log_lam) - np.square(se_log_lam)).max()), .5 * np.log(2))))
Compare the log likelihoods of the fitted models.
pd.Series({'identity': np.array(malat1_res.rx2('loglik')[0]),
           'log': np.array(malat1_log_link_res.rx2('loglik'))[0]})
identity    -77332.04902555935
log                   -64994.7
dtype: object
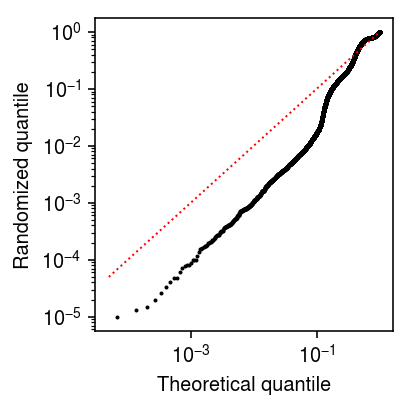
Plot randomized quantiles for the log link solution.
Fx_1 = scmodes.benchmark.gof._ash_cdf(malat1_counts - 1, malat1_log_link_res, s=s)
fx = scmodes.benchmark.gof._ash_pmf(malat1_counts, malat1_log_link_res)
plt.clf()
plt.gcf().set_size_inches(3, 3)
plt.xscale('log')
plt.yscale('log')
plt.scatter(np.linspace(0, 1, malat1_counts.shape[0] + 2)[1:-1], np.sort(Fx_1 + np.random.uniform(size=malat1_counts.shape[0]) * fx), s=1, c='k')
plt.plot([5e-5, 1], [5e-5, 1], lw=1, ls=':', c='r')
plt.xlabel('Theoretical quantile')
plt.ylabel('Randomized quantile')
plt.tight_layout()
Test for GOF.
st.kstest(Fx_1 + np.random.uniform(size=malat1_counts.shape[0]) * fx, 'uniform')