Pathological behavior of the Leiden algorithm
Table of Contents
Introduction
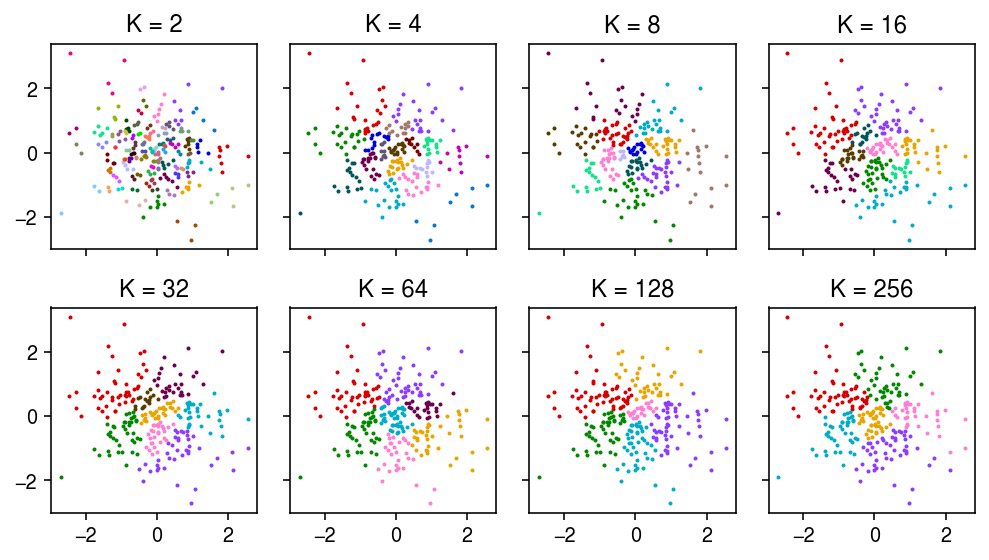
I claim the Leiden algorithm (Traag et al. 2018) can invent communities in iid. multivariate Gaussian data that had no community structure. Here, I show an example where this happens.
Setup
import anndata
import numpy as np
import pandas as pd
import scanpy as sc
%matplotlib inline
%config InlineBackend.figure_formats = set(['retina'])
import colorcet
import matplotlib.pyplot as plt
plt.rcParams['figure.facecolor'] = 'w'
plt.rcParams['font.family'] = 'Nimbus Sans'
Results
Simulate data from
\begin{equation} \mathbf{x}_i \sim \operatorname{\mathcal{N}}(\boldsymbol{0}, \mathbf{I}), \qquad i = 1, \ldots, n \end{equation}rng = np.random.default_rng(1) # Important: we consider up to k=256 neighbors n = 257 p = 2 x = rng.normal(size=(n, p)) dat = anndata.AnnData(x)
Run the Leiden algorithm for different \(k\)-nearest neighbors graphs, varying \(k\).
K = (2, 4, 8, 16, 32, 64, 128, 256)
for k in K:
  sc.pp.neighbors(dat, n_neighbors=k, key_added=f'K{k}')
  sc.tl.leiden(dat, neighbors_key=f'K{k}', key_added=f'leiden_K{k}')
Plot the data and learned communities.
plt.clf()
fig, ax = plt.subplots(2, 4, sharex=True, sharey=True)
fig.set_size_inches(7, 4)
for a, k in zip(ax.ravel(), K):
  for j in pd.Categorical(dat.obs[f'leiden_K{k}']).categories:
    idx = dat.obs[f'leiden_K{k}'] == j
    a.scatter(x[idx,0], x[idx,1], color=colorcet.cm['glasbey_dark'](int(j)), s=1)
    a.set_title(f'K = {k}')
fig.tight_layout()

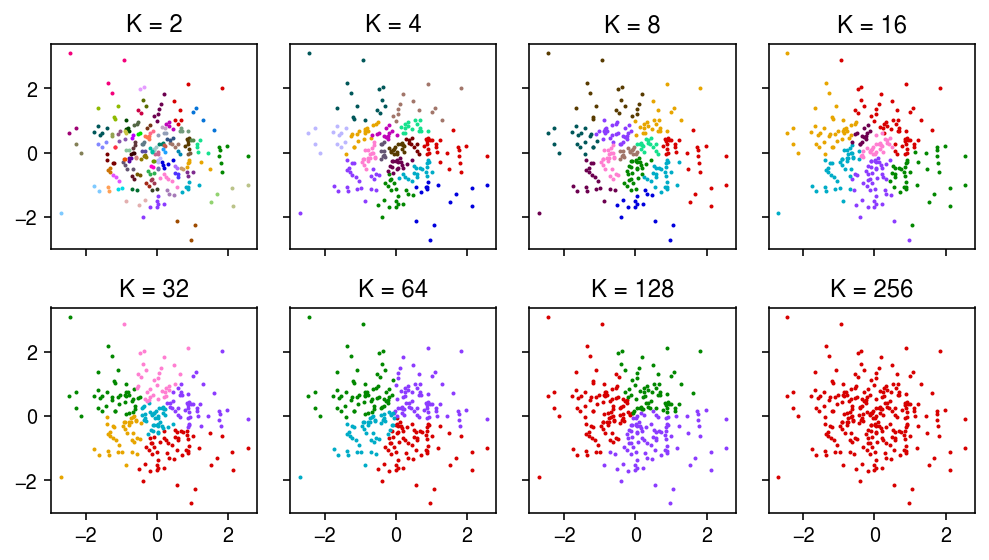
Repeat for the Louvain algorithm.
K = (2, 4, 8, 16, 32, 64, 128, 256)
for k in K:
  sc.pp.neighbors(dat, n_neighbors=k, key_added=f'K{k}')
  sc.tl.louvain(dat, neighbors_key=f'K{k}', key_added=f'louvain_K{k}')
plt.clf()
fig, ax = plt.subplots(2, 4, sharex=True, sharey=True)
fig.set_size_inches(7, 4)
for a, k in zip(ax.ravel(), K):
  for j in pd.Categorical(dat.obs[f'louvain_K{k}']).categories:
    idx = dat.obs[f'louvain_K{k}'] == j
    a.scatter(x[idx,0], x[idx,1], color=colorcet.cm['glasbey_dark'](int(j)), s=1)
    a.set_title(f'K = {k}')
fig.tight_layout()
